01. R <- Plot 图像参数
大二的下学期学习了生物统计学,在课程的最后老师推荐我们学习一门变成语言,首先学习的是Python,因为做分析的时候得到的数据相对不完整,其实是我实在懒得自己编写程序去计算一些其它的量。最后决定开始学习R语言,因此此文权当我自身学习R语言做统计学分析时候的一点小总结和笔记吧。
使用的数据(集)
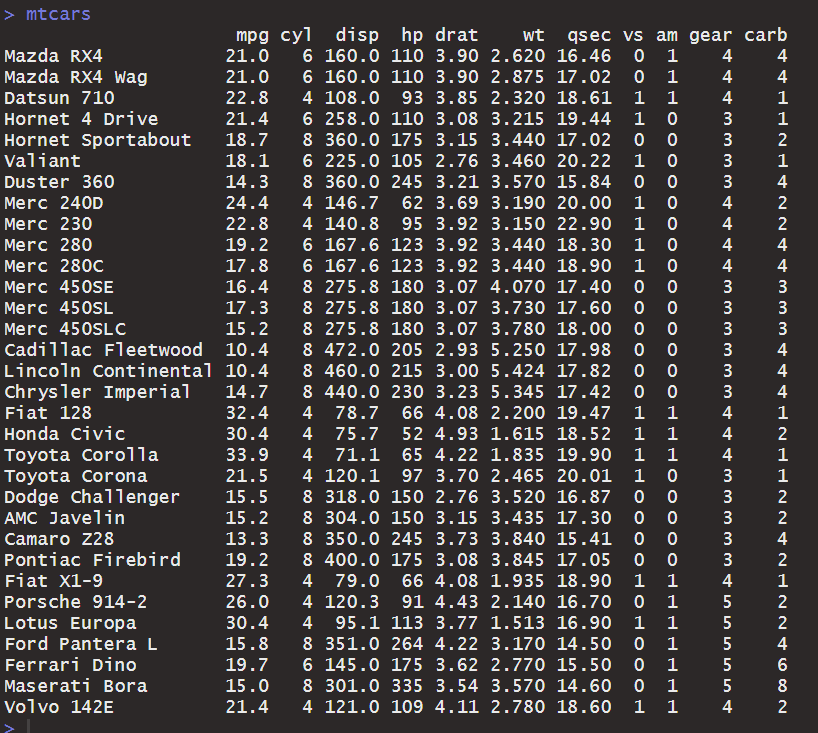
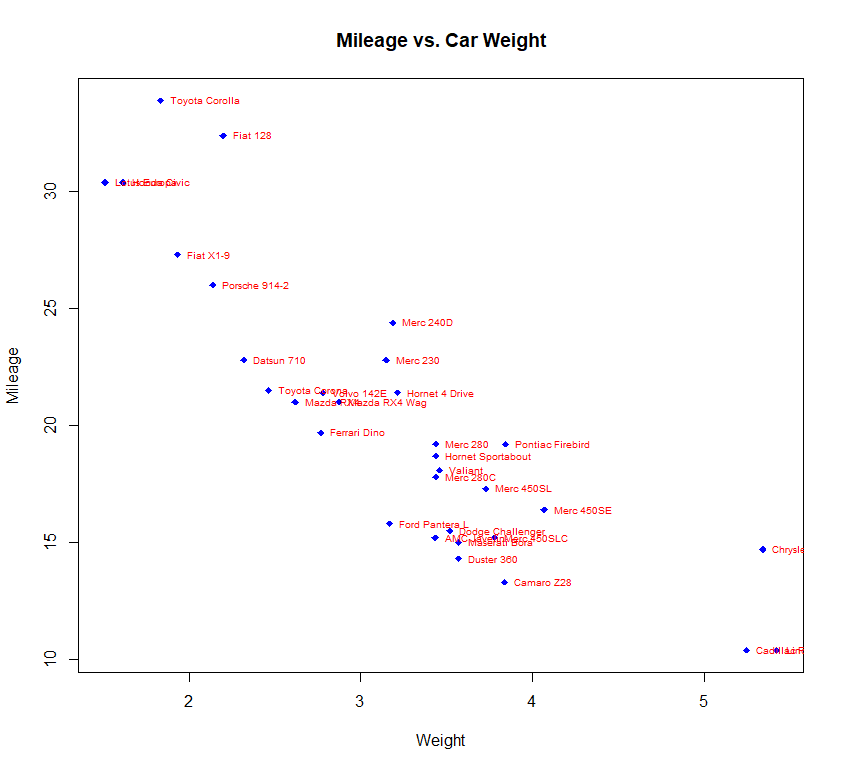
这篇文章中使用到的数据有R Studio还是R Language自带的 mtcars :
以及一些方便演示而创建的数据集:
1 | |
使用的Package
在绘图过程中,常用的包有很多,在下文中使用到的包也有很多交叉的地方,因为练习使用R语言的时候使用的是R Studio,这个软件的包管理做的简单明了,当有前置包需要载入的时候也会自动下载并载入,因此在此只列出所用package调用代码:
例:
1 | |
下面是相关代码:
1 | |
一、通用绘图操作
合并、新建、保存
1 | |
参数的保存和使用
对于不同的图像,需要设置的参数可能也不同。
最简单的方法是直接在绘图函数后面设置相应的参数,如:plot(c(1,2,3), main = "Main Title")
第二种方法是直接改变全局变量:par(main = "Main Title")
第三种方法稍显复杂,但是它可以对于每一个图片进行设置,同时保留每个图片的相关设置:
1 | |
图形的组合
在R中使用函数par()或layout()可以容易地组合多幅图形为一幅总括图形。
1. 直接修改par
你可以在par()函数中使用图形参数mfrow=c(nrows, ncols)来创建按行填充的、行数为nrows、列数为ncols的图形矩阵。另外,可以使用mfcol=c(nrows, ncols)按列填充矩阵。
例:
1 | |
2. 使用layout()
函数layout()的调用形式为layout(mat),其中的mat是一个矩阵,它指定了所要组合的多个图形的所在位置。
mat的含义如下:如mat = matrix(c(1,1,2,3)),,表示接下啦
layout()的调用格式为:
1 | |
例:
1 | |
为了更精确地控制每幅图形的大小,可以有选择地在layout()函数中使用widths=和heights=两个参数。其形式为:
1 | |
例:
1 | |
二、绘图参数
通用的绘图参数对于基本绘图操作都有效,但是对于使用ggplot2包的情况来说,需要使用ggplot2的特殊方式来进行参数设置
使用绘图参数
绘图参数有很多,首先可以通过par()来查看所有的参数,也可以使用par()进行全局设置:
1 | |
样式:符号 (点)、线条
1. 相关参数
| 参数 | 描述 |
|---|---|
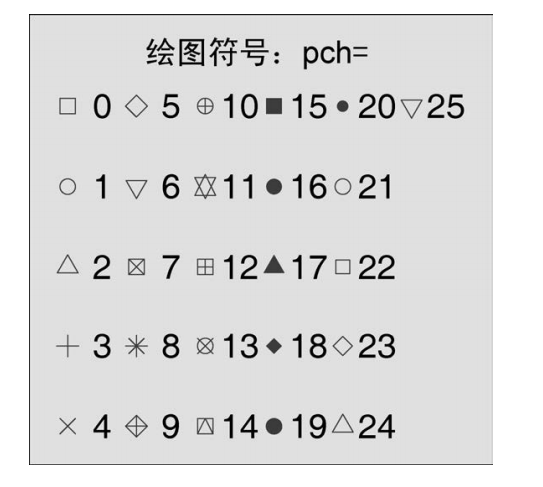
| pch (plotting character) | 指定绘制点时使用的符号 |
| cex | 指定符号的大小。cex 是一个数值,表示绘图符号相对于默认大小的缩放倍数。默认大小为 1,1.5 表示放大为默认值的 1.5 倍,0.5 表示缩小为默认值的 50%,等等 |
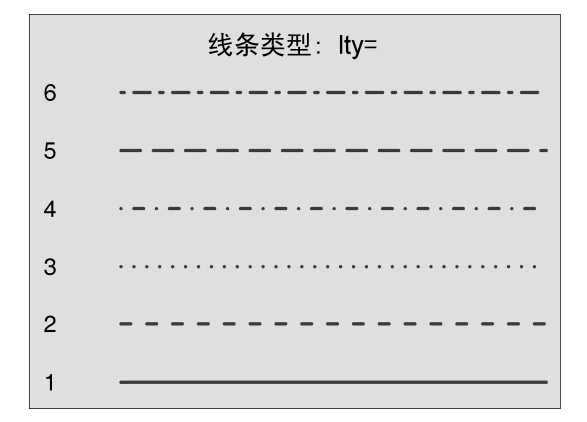
| lty | 指定线条类型 |
| lwd | 指定线条宽度。lwd 是以默认值的相对大小来表示的(默认值为 1)。例如,lwd=2 将生成一条两倍于默认宽度的线条 |
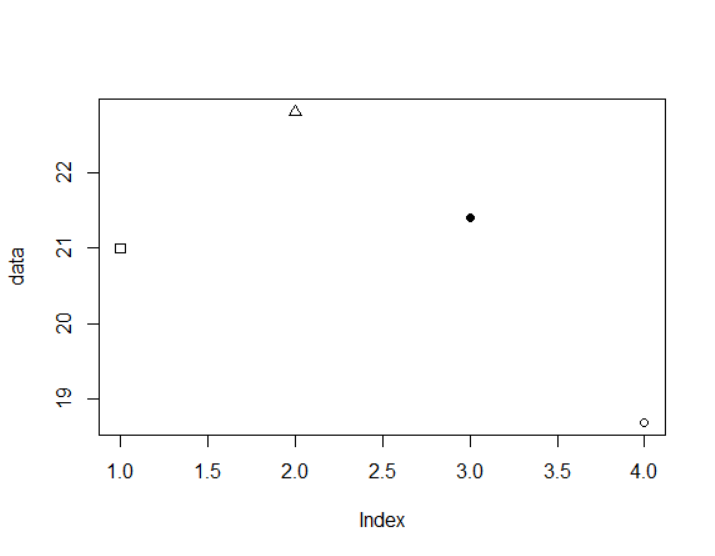
2. 符号样式
例:
1 | |
3. 线条类型
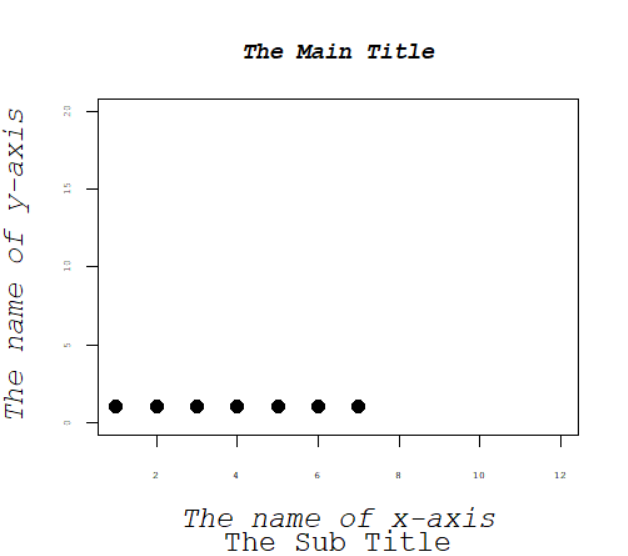
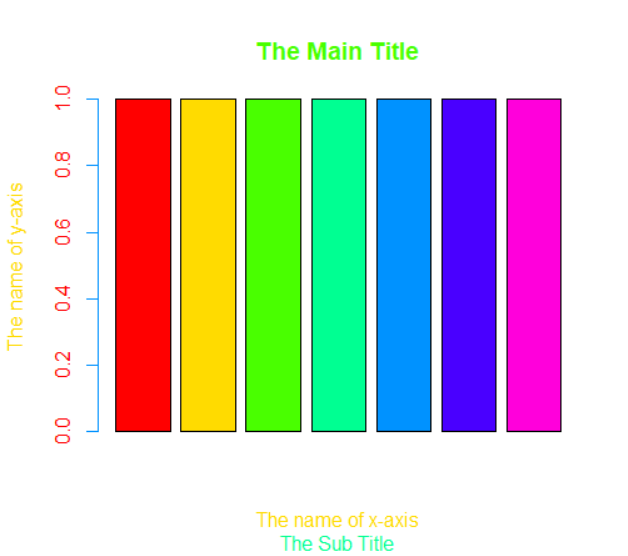
文本
| 参数 | 描述 |
|---|---|
| main | 主标题 |
| sub | 副标题 |
| xlab | x轴名称 |
| ylab | y轴名称 |
| xlim | x轴坐标轴范围 |
| ylim | y轴坐标轴范围 |
| cex | 表示相对于默认大小缩放倍数的数值。默认大小为 1,1.5 表示放大为默认值的 1.5 倍,0.5 表示缩小为默认值的 50%,等等 |
| cex.axis | 坐标轴刻度文字的缩放倍数。类似于 cex |
| cex.lab | 坐标轴标签(名称)的缩放倍数。类似于 cex |
| cex.main | 标题的缩放倍数。类似于 cex |
| cex.sub | 副标题的缩放倍数。类似于 cex |
| font | 整数。用于指定绘图使用的字体样式。1=常规,2=粗体,3=斜体,4=粗斜体,5=符号字体(以Adobe符号编码表示) |
| font.axis | 坐标轴刻度文字的字体样式 |
| font.lab | 坐标轴标签(名称)的字体样式 |
| font.main | 标题的字体样式 |
| font.sub | 副标题的字体样式 |
| ps | 字体磅值(1磅约为1/72英寸)。文本的最终大小为ps*cex |
| family | 绘制文本时使用的字体族。标准的取值为serif(衬线)、sans(无衬线)和mono(等宽) |
例:
1 | |
颜色
1. 参数
| 参数 | 描述 |
|---|---|
| col (color) | 图表内容的的绘图颜色。 某些函数(如 lines 和 pie)可以接受一个含有颜色值的向量并**自动循环使用**。例如,如果设定 col=c(“red”, “blue”)并需要绘制三条线,则第一条线将为红色,第二条线为蓝色,第三条线又将为红色 |
| col.axis | 坐标轴刻度文字的颜色 |
| col.lab | 坐标轴标签(名称)的颜色 |
| col.main | 标题颜色 |
| col.sub | 副标题颜色 |
| fg (foreground) | 图形的前景色 |
| bg (background) | 填充色 |
- 对于符号21~25,可以指定边界颜色(col)和填充色(bg)
- 在R中,可以通过颜色下标、颜色名称、十六进制的颜色值、RGB值或HSV值来指定颜色。
- 举例来说,
col=1、col="white"、col="#FFFFFF"、col=rgb(1,1,1)和col=hsv(0,0,1)都是表示白色的等价方式。 - 函数
rgb()可基于红-绿-蓝三色值生成颜色,而hsv()则基于色相-饱和度-亮度值来生成颜色。- rgb的取值范围是[0,1],RGB的取值范围是[0,255]
- 举例来说,
举例:
1 | |
常用十六进制颜色码
| 英文代码 | 形像颜色 | HEX格式 | RGB格式 |
|---|---|---|---|
| LightPink | 浅粉色 <- 示例 | #FFB6C1 | 255,182,193 |
| Pink | 粉红 <- 示例 | #FFC0CB | 255,192,203 |
| Crimson | 猩红 <- 示例 | #DC143C | 220,20,60 |
| LavenderBlush | 偏红的淡紫色 <- 示例 | #FFF0F5 | 255,240,245 |
| PaleVioletRed | 苍白的紫罗兰红色 <- 示例 | #DB7093 | 219,112,147 |
| HotPink | 热情的粉红 <- 示例 | #FF69B4 | 255,105,180 |
| DeepPink | 深粉色 <- 示例 | #FF1493 | 255,20,147 |
| MediumVioletRed | 适中的紫罗兰红色 <- 示例 | #C71585 | 199,21,133 |
| Orchid | 兰花的紫色 <- 示例 | #DA70D6 | 218,112,214 |
| Thistle | 蓟 <- 示例 | #D8BFD8 | 216,191,216 |
| plum | 李子 <- 示例 | #DDA0DD | 221,160,221 |
| Violet | 紫罗兰 <- 示例 | #EE82EE | 238,130,238 |
| Light Purple | 亮紫色 <- 示例 | #FF00FF | 255,0,255 |
| Pure Purple | 纯紫 <- 示例 | #FF00FF | 255,0,255 |
| DarkPurple | 深紫色 <- 示例 | #8B008B | 139,0,139 |
| Purple | 紫色 <- 示例 | #800080 | 128,0,128 |
| MediumOrchid | 适中的兰花紫 <- 示例 | #BA55D3 | 186,85,211 |
| DarkVoilet | 深蓝紫色 <- 示例 | #9400D3 | 148,0,211 |
| DarkOrchid | 深兰花紫 <- 示例 | #9932CC | 153,50,204 |
| Indigo | 靛青 <- 示例 | #4B0082 | 75,0,130 |
| BlueViolet | 深紫罗兰的蓝色 <- 示例 | #8A2BE2 | 138,43,226 |
| MediumPurple | 适中的蓝紫色 <- 示例 | #9370DB | 147,112,219 |
| MediumSlateBlue | 适中的板岩暗蓝灰色 <- 示例 | #7B68EE | 123,104,238 |
| SlateBlue | 板岩暗蓝灰色 <- 示例 | #6A5ACD | 106,90,205 |
| DarkSlateBlue | 深岩暗蓝灰色 <- 示例 | #483D8B | 72,61,139 |
| Lavender | 薰衣草花的淡紫色 <- 示例 | #E6E6FA | 230,230,250 |
| GhostWhite | 幽灵的白色 <- 示例 | #F8F8FF | 248,248,255 |
| Indigo Blue | 靛蓝 <- 示例 | #0000FF | 0,0,255 |
| MediumBlue | 适中的蓝色 <- 示例 | #0000CD | 0,0,205 |
| MidnightBlue | 午夜的蓝色 <- 示例 | #191970 | 25,25,112 |
| DarkBlue | 深蓝色 <- 示例 | #00008B | 0,0,139 |
| Navy | 海军蓝,深靛蓝 <- 示例 | #000080 | 0,0,128 |
| RoyalBlue | 宝蓝 <- 示例 | #4169E1 | 65,105,225 |
| CornflowerBlue | 矢车菊的蓝色 <- 示例 | #6495ED | 100,149,237 |
| LightSteelBlue | 淡钢蓝 <- 示例 | #B0C4DE | 176,196,222 |
| LightSlateGray | 浅石板灰 <- 示例 | #778899 | 119,136,153 |
| SlateGray | 石板灰 <- 示例 | #708090 | 112,128,144 |
| DodgerBlue | 道奇蓝 <- 示例 | #1E90FF | 30,144,255 |
| AliceBlue | 爱丽丝蓝 <- 示例 | #F0F8FF | 240,248,255 |
| SteelBlue | 钢蓝 <- 示例 | #4682B4 | 70,130,180 |
| LightSkyBlue | 淡蓝色 <- 示例 | #87CEFA | 135,206,250 |
| TianyiBlue | 天依蓝 <- 示例 | #66CCFF | |
| SkyBlue | 天蓝色 <- 示例 | #87CEEB | 135,206,235 |
| DeepSkyBlue | 深天蓝 <- 示例 | #00BFFF | 0,191,255 |
| LightBLue | 淡蓝 <- 示例 | #ADD8E6 | 173,216,230 |
| PowDerBlue | 火药蓝 <- 示例 | #B0E0E6 | 176,224,230 |
| CadetBlue | 军校蓝 <- 示例 | #5F9EA0 | 95,158,160 |
| Azure | 蔚蓝色 <- 示例 | #F0FFFF | 240,255,255 |
| LightCyan | 淡青色 <- 示例 | #E1FFFF | 225,255,255 |
| PaleTurquoise | 苍白的绿宝石 <- 示例 | #AFEEEE | 175,238,238 |
| Cyan | 青色 <- 示例 | #00FFFF | 0,255,255 |
| Aqua | 水绿色 <- 示例 | #00FFFF | 0,255,255 |
| DarkTurquoise | 深绿宝石 <- 示例 | #00CED1 | 0,206,209 |
| DarkSlateGray | 深石板灰 <- 示例 | #2F4F4F | 47,79,79 |
| DarkCyan | 深青色 <- 示例 | #008B8B | 0,139,139 |
| Teal | 水鸭色 <- 示例 | #008080 | 0,128,128 |
| MediumTurquoise | 适中的绿宝石 <- 示例 | #48D1CC | 72,209,204 |
| LightSeaGreen | 浅海洋绿 <- 示例 | #20B2AA | 32,178,170 |
| Turquoise | 绿宝石 <- 示例 | #40E0D0 | 64,224,208 |
| BabyGreen | 绿玉 <- 示例 | #7FFFAA | 127,255,170 |
| MediumAquamarine | 适中的碧绿色 <- 示例 | #00FA9A | 0,250,154 |
| MediumSpringGreen | 适中的春天的绿色 <- 示例 | #F5FFFA | 245,255,250 |
| MintCream | 薄荷奶油 <- 示例 | #00FF7F | 0,255,127 |
| SpringGreen | 春天的绿色 <- 示例 | #3CB371 | 60,179,113 |
| SeaGreen | 海洋绿 <- 示例 | #2E8B57 | 46,139,87 |
| Honeydew | 蜂蜜 <- 示例 | #F0FFF0 | 240,255,0 |
| LightGreen | 淡绿色 <- 示例 | #90EE90 | 144,238,144 |
| PaleGreen | 苍白的绿色 <- 示例 | #98FB98 | 152,251,152 |
| DarkSeaGreen | 深海洋绿 <- 示例 | #8FBC8F | 143,188,143 |
| LimeGreen | 酸橙绿 <- 示例 | #32CD32 | 50,205,50 |
| Lime | 纯绿,草绿色 <- 示例 | #00FF00 | 0,255,0 |
| ForestGreen | 森林绿 <- 示例 | #228B22 | 34,139,34 |
| Green | 深绿 <- 示例 | #008000 | 0,128,0 |
| DarkGreen | 深绿色 <- 示例 | #006400 | 0,100,0 |
| Chartreuse | 查特酒绿 <- 示例 | #7FFF00 | 127,255,0 |
| LawnGreen | 草坪绿 <- 示例 | #7CFC00 | 124,252,0 |
| GreenYellow | 绿黄色 <- 示例 | #ADFF2F | 173,255,47 |
| OliveDrab | 橄榄土褐色 <- 示例 | #556B2F | 85,107,47 |
| Beige | 米色(浅褐色) <- 示例 | #6B8E23 | 107,142,35 |
| LightGoldenrodYellow | 浅秋麒麟黄 <- 示例 | #FAFAD2 | 250,250,210 |
| Ivory | 象牙色 <- 示例 | #FFFFF0 | 255,255,240 |
| LightYellow | 浅黄色 <- 示例 | #FFFFE0 | 255,255,224 |
| Yellow | 柠檬黄 <- 示例 | #FFFF00 | 255,255,0 |
| Olive | 橄榄绿 <- 示例 | #808000 | 128,128,0 |
| DarkKhaki | 深卡其布 <- 示例 | #BDB76B | 189,183,107 |
| LemonChiffon | 柠檬薄纱 <- 示例 | #FFFACD | 255,250,205 |
| PaleGodenrod | 灰秋麒麟 <- 示例 | #EEE8AA | 238,232,170 |
| Khaki | 卡其布 <- 示例 | #F0E68C | 240,230,140 |
| Gold | 金 <- 示例 | #FFD700 | 255,215,0 |
| Cornislk | 玉米色 <- 示例 | #FFF8DC | 255,248,220 |
| GoldEnrod | 秋麒麟 <- 示例 | #DAA520 | 218,165,32 |
| FloralWhite | 花的白色 <- 示例 | #FFFAF0 | 255,250,240 |
| OldLace | 老饰带 <- 示例 | #FDF5E6 | 253,245,230 |
| Wheat | 小麦色 <- 示例 | #F5DEB3 | 245,222,179 |
| Moccasin | 鹿皮鞋 <- 示例 | #FFE4B5 | 255,228,181 |
| Orange | 橙色 <- 示例 | #FFA500 | 255,165,0 |
| PapayaWhip | 番木瓜 <- 示例 | #FFEFD5 | 255,239,213 |
| BlanchedAlmond | 漂白的杏仁 <- 示例 | #FFEBCD | 255,235,205 |
| NavajoWhite | Navajo白 <- 示例 | #FFDEAD | 255,222,173 |
| AntiqueWhite | 古代的白色 <- 示例 | #FAEBD7 | 250,235,215 |
| Tan | 晒黑 <- 示例 | #D2B48C | 210,180,140 |
| BrulyWood | 结实的树 <- 示例 | #DEB887 | 222,184,135 |
| Bisque | (浓汤)乳脂,番茄等 <- 示例 | #FFE4C4 | 255,228,196 |
| DarkOrange | 深橙色 <- 示例 | #FF8C00 | 255,140,0 |
| Linen | 亚麻布 <- 示例 | #FAF0E6 | 250,240,230 |
| Peru | 秘鲁 <- 示例 | #CD853F | 205,133,63 |
| PeachPuff | 桃色 <- 示例 | #FFDAB9 | 255,218,185 |
| SandyBrown | 沙棕色 <- 示例 | #F4A460 | 244,164,96 |
| Chocolate | 巧克力 <- 示例 | #D2691E | 210,105,30 |
| SaddleBrown | 马鞍棕色 <- 示例 | #8B4513 | 139,69,19 |
| SeaShell | 海贝壳 <- 示例 | #FFF5EE | 255,245,238 |
| Sienna | 黄土赭色 <- 示例 | #A0522D | 160,82,45 |
| LightSalmon | 浅鲜肉(鲑鱼)色 <- 示例 | #FFA07A | 255,160,122 |
| Coral | 珊瑚 <- 示例 | #FF7F50 | 255,127,80 |
| OrangeRed | 橙红色 <- 示例 | #FF4500 | 255,69,0 |
| DarkSalmon | 深鲜肉(鲑鱼)色 <- 示例 | #E9967A | 233,150,122 |
| Tomato | 番茄 <- 示例 | #FF6347 | 255,99,71 |
| MistyRose | 薄雾玫瑰 <- 示例 | #FFE4E1 | 255,228,225 |
| Salmon | 鲜肉(鲑鱼)色 <- 示例 | #FA8072 | 250,128,114 |
| Snow | 雪 <- 示例 | #FFFAFA | 255,250,250 |
| LightCoral | 淡珊瑚色 <- 示例 | #F08080 | 240,128,128 |
| RosyBrown | 玫瑰棕色 <- 示例 | #BC8F8F | 188,143,143 |
| IndianRed | 印度红 <- 示例 | #CD5C5C | 205,92,92 |
| Red | 纯红 <- 示例 | #FF0000 | 255,0,0 |
| Brown | 棕色 <- 示例 | #A52A2A | 165,42,42 |
| FireBrick | 耐火砖 <- 示例 | #B22222 | 178,34,34 |
| DarkRed | 深红色 <- 示例 | #8B0000 | 139,0,0 |
| Maroon | 栗色 <- 示例 | #800000 | 128,0,0 |
| White | 纯白 <- 示例 | #FFFFFF | 255,255,255 |
| WhiteSmoke | 白烟 <- 示例 | #F5F5F5 | 245,245,245 |
| Gainsboro | Gainsboro <- 示例 | #DCDCDC | 220,220,220 |
| LightGray | 浅灰色 <- 示例 | #D3D3D3 | 211,211,211 |
| Silver | 银白色 <- 示例 | #C0C0C0 | 192,192,192 |
| DarkGray | 深灰色 <- 示例 | #A9A9A9 | 169,169,169 |
| Gray | 灰色 <- 示例 | #808080 | 128,128,128 |
| DimGray | 暗淡的灰色 <- 示例 | #696969 | 105,105,105 |
| Black | 纯黑 <- 示例 | #000000 | 0,0,0 |
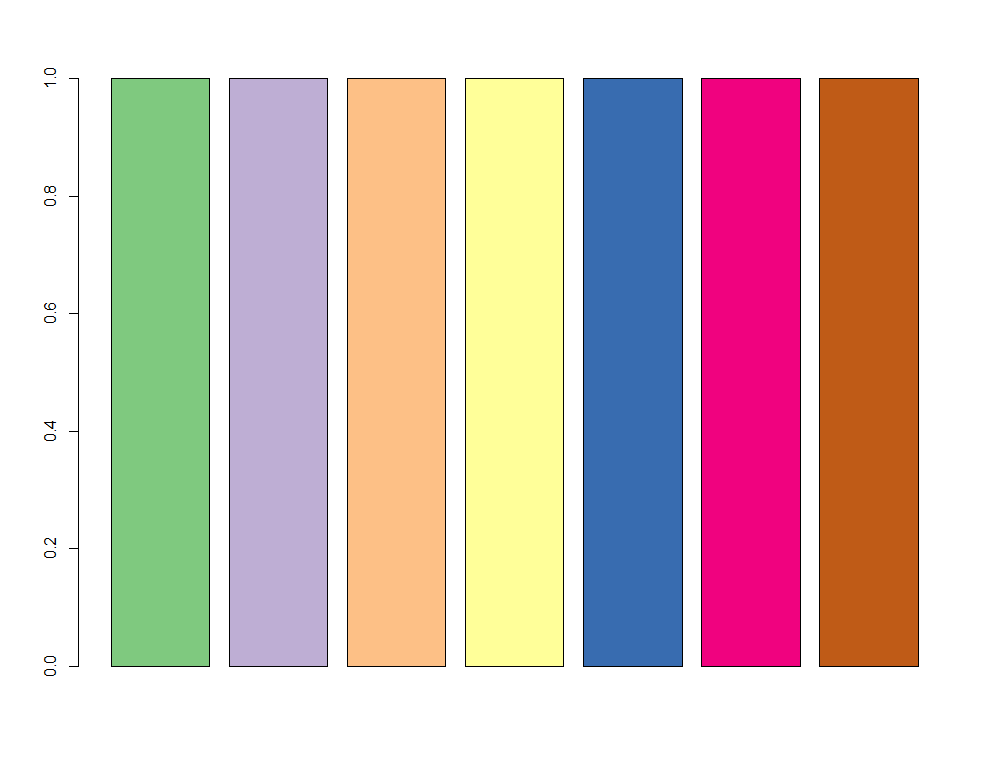
2. 使用包来获得颜色
R中预设了很多种颜色,可以通过colors()来查看当前可以使用的预设颜色
R中也有多种用于创建连续型颜色向量的函数,包括rainbow()、heat.colors()、terrain.colors()、topo.colors()以及cm.colors()。举例来说,rainbow(10)可以生成10种连续的“彩虹型”颜色。
与此同时,也可以使用第三方包RColorBrewer来选择一些吸引人的颜色:
1 | |

使用brewer.pal(n,"Set Name")来获得一个颜色值的向量,如:
1 | |
图形尺寸和边界尺寸
| 参数 | 描述 |
|---|---|
| pin | 以英寸表示的图形尺寸(宽和高) |
| mai | 以数值向量表示的边界大小,顺序为“下、左、上、右”,单位为英寸 |
| mar | 以数值向量表示的边界大小,顺序为“下、左、上、右”,单位为英分①。默认值为 c(5, 4, 4, 2) + 0.1 |
在图片上继续修改
1. 标题
在已经绘制出一个图像的时候,可以在这张图的基础上继续修改
可以使用title()函数为图形添加标题和坐标轴标签。调用格式为:
1 | |
函数title()中亦可指定其他图形参数(如文本大小、字体、旋转角度和颜色)。举例来说,以下代码将生成红色的标题和蓝色的副标题,以及比默认大小小25%的绿色x轴、y轴标签:
1 | |
2. 自定义坐标轴
可以使用函数axis()来创建自定义的坐标轴,而非使用R中的默认坐标轴。其格式为:
1 | |
相关参数如下:
| 选项 | 描述 |
|---|---|
| side | 一个整数,表示在图形的哪边绘制坐标轴(1=下,2=左,3=上,4=右) |
| at | 一个数值型向量,表示需要绘制刻度线的位置 |
| labels | 一个字符型向量,表示置于刻度线旁边的文字标签(如果为 NULL,则将直接使用 at 中的值) |
| pos | 坐标轴线绘制位置的坐标(即与另一条坐标轴相交位置的值) |
| lty | 线条类型 |
| col | 线条和刻度线颜色 |
| las | 标签是否平行于(=0)或垂直于(=2)坐标轴 numeric in {0,1,2,3}; the style of axis labels. 0: always parallel to the axis [default], 1: always horizontal, 2: always perpendicular to the axis, 3: always vertical. Also supported by mtext. Note that string/character rotation via argument srt to par does not affect the axis labels. |
| tck | 刻度线的长度,以相对于绘图区域大小的分数表示(负值表示在图形外侧,正值表示在图形内侧,0表示禁用刻度,1表示绘制网格线);默认值为–0.01 |
| xaxt=”n” | 禁用x坐标轴(会留下框架线,只是去除了刻度) |
| yaxt=”n” | 禁用y坐标轴 |
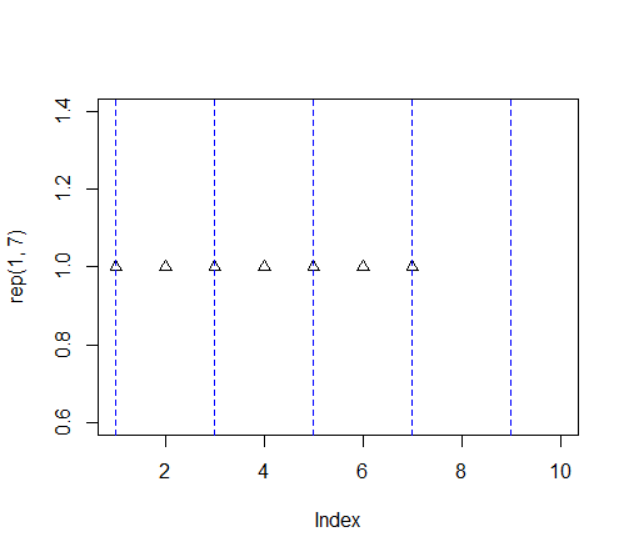
3. 参考线
函数abline()可以用来为图形添加参考线。其使用格式为:
1 | |
函数abline()中也可以指定其他图形参数(如线条类型、颜色和宽度):
1 | |
举例:
1 | |
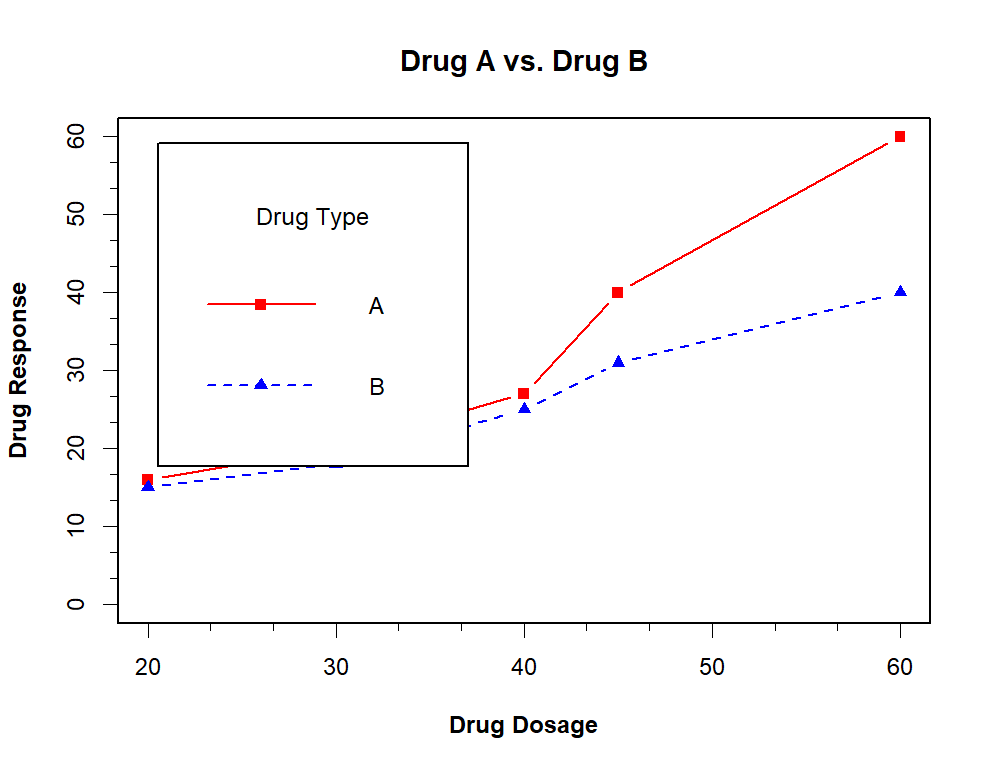
4. 图例
当图形中包含的数据不止一组时,图例可以帮助你辨别出每个条形、扇形区域或折线各代表哪一类数据。我们可以使用函数legend()来添加图例:
1 | |
| 选项 | 描述 |
|---|---|
| location | 有许多方式可以指定图例的位置。 你可以直接给定图例左上角的x、y坐标,也可以执行 locator(1),然后通过鼠标单击给出图例的位置,还可以使用关键字 “bottomright”, “bottom”, “bottomleft”, “left”, “topleft”, “top”, “topright”, “right”, “center”放置图例。如果你使用了以上某个关键字,那么可以同时使用参数inset=指定图例向图形内侧移动的大小(以绘图区域大小的分数表示) |
| title | 图例标题的字符串(可选) |
| legend | 图例标签组成的字符型向量 |
| x, y | the x and y co-ordinates to be used to position the legend. |
| fill | if specified, this argument will cause boxes filled with the specified colors (or shaded in the specified colors) to appear beside the legend text |
| col | the color of points or lines appearing in the legend. |
| border | the border color for the boxes (used only if fill is specified). |
| lty, lwd | the plotting symbols appearing in the legend, as numeric vector or a vector of 1-character strings. Unlike points, this can all be specified as a single multi-character string. Must be specified for symbol drawing. |
| angle | angle of shading lines. |
| density | the density of shading lines, if numeric and positive. If NULL or negative or NA color filling is assumed. |
| bty | the type of box to be drawn around the legend. The allowed values are “o” (the default) and “n”. |
| bg | the background color for the legend box. (Note that this is only used if bty != “n”.) |
| box.lty, box.lwd, box.col | the line type, width and color for the legend box (if bty = “o”). |
| pt.bg | the background color for the points, corresponding to its argument bg. |
| cex | character expansion factor relative to current par(“cex”). Used for text, and provides the default for pt.cex. |
| pt.cex | expansion factor(s) for the points. |
| pt.lwd | line width for the points, defaults to the one for lines, or if that is not set, to par(“lwd”). |
| xjust | how the legend is to be justified relative to the legend x location. A value of 0 means left justified, 0.5 means centered and 1 means right justified. |
| yjust | the same as xjust for the legend y location. |
| x.intersp | character interspacing factor for horizontal (x) spacing. |
| y.intersp | the same for vertical (y) line distances. |
| adj | numeric of length 1 or 2; the string adjustment for legend text. Useful for y-adjustment when labels are plotmath expressions. |
| text.width | the width of the legend text in x (“user”) coordinates. (Should be a single positive number even for a reversed x axis.) Defaults to the proper value computed by strwidth(legend). |
| text.col | the color used for the legend text. |
| text.font | the font used for the legend text, see text. |
| merge | logical; if TRUE, merge points and lines but not filled boxes. Defaults to TRUE if there are points and lines. |
| trace | logical; if TRUE, shows how legend does all its magical computations. |
| plot | logical. If FALSE, nothing is plotted but the sizes are returned. |
| ncol | the number of columns in which to set the legend items (default is 1, a vertical legend). |
| horiz | logical; if TRUE, set the legend horizontally rather than vertically (specifying horiz overrides the ncol specification). |
| inset | inset distance(s) from the margins as a fraction of the plot region when legend is placed by keyword. |
| xpd | if supplied, a value of the graphical parameter xpd to be used while the legend is being drawn. |
| title.col | color for title. |
| title.adj | horizontal adjustment for title: see the help for par(“adj”). |
| seg.len | the length of lines drawn to illustrate lty and/or lwd (in units of character widths). |
| ··· | 其他选项。如果图例标示的是颜色不同的线条,需要指定col=加上颜色值组成的向量。如果图例标示的是符号不同的点,则需指定pch=加上符号的代码组成的向量。如果图例标示的是不同的线条宽度或线条类型,请使用lwd=或lty=加上宽度值或类型值组成的向量。要为图例创建颜色填充的盒形(常见于条形图、箱线图或饼图),需要使用参数fill=加上颜色值组成的向量 |
举例:
1 | |
5. 标注
文本标注
可以通过函数text()和mtext()将文本添加到图形上。
text()可向绘图区域内部添加文本,而mtext()则向图形的四个边界之一添加文本。
- text()函数也通常用来标示图形中的点。我们只需指定一系 列的x、y坐标作为位置参数,同时以向量的形式指定要放置的文本。x、y和文本标签向量的长度应当相同。
使用格式分别为:
1 | |
| 参数 | 描述 |
|---|---|
| location | 文本的位置参数。可为一对 x、y 坐标,也可通过指定 location 为 locator(1)使用鼠标交互式地确定摆放位置 |
| pos | 文本相对于位置参数的方位。1=下,2=左,3=上,4=右。如果指定了 pos,就可以同时指定参数 offset= 作为偏移量,以相对于单个字符宽度的比例表示 |
| side | 指定用来放置文本的边。1=下,2=左,3=上,4=右。你可以指定参数 line=来内移或外移文本,随着值的增加,文本将外移。也可使用 adj=0 将文本向左下对齐,或使用 adj=1 右上对齐 |
例:
1 | |
数学标注
可以使用类似于 TeX 中的写法为图形添加数学符号和公式。
要即时看效果,可以尝试执行demo(plotmath)。
函数plotmath()可以为图形主体或边界上的标题、坐标轴名称或文本标注添加数学符号。