L07 Interorgan and Intracellular Coordination of Energy Metabolism in Vertebrates
Interorgan and Intracellular Coordination of Energy Metabolism in Vertebrates
- 脊椎动物器官间和细胞内能源代谢的协调
一、Interdependence of the Major Organs in Vertebrate Fuel Metabolism
Metabolite concentrations represent a significant intracellular control mechanism (availability of substrate).
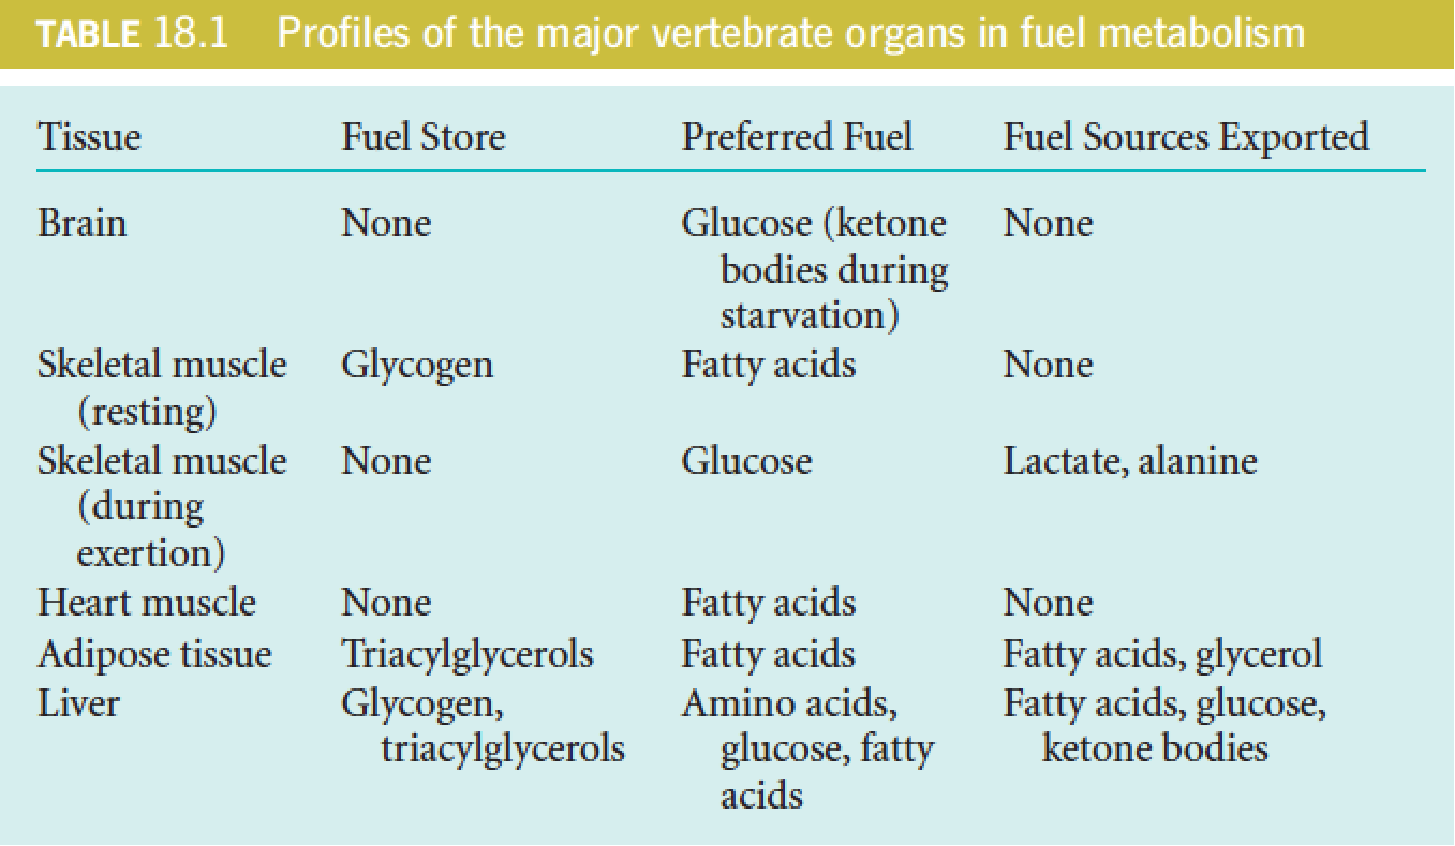
The major fuel depots are triacylglycerols (adipose tissue), protein (muscle), and glycogen (muscle and liver).
- Marathon run: glycogen ➔ fatty acids
- Metabolic adaptation
Fuel Inputs and Outputs
Kidney must generate ATP for the osmotic work of transporting solutes against a concentration gradient for excretion;
Muscle: ATP/mechanical work of contraction;
Heart muscle: the energy supply must be continuous;
Liver: ATP/ biosynthesis purposes, plasma protein synthesis, cholesterol generation, fatty acid synthesis, gluconeogenesis, or the production of urea for nitrogen excretion;
Energy production must meet needs that vary widely, depending on level of exertion, composition of fuel molecules in the diet, time since last feeding, and so forth;
In humans the daily caloric intake may vary by 4-fold, depending in part on the level of exertion—from 1500 to 6000 kcal/day (6000 to 25,000 kJ/day) in an average-sized human (1 kcal is equal to 1 large calorie, or Cal).
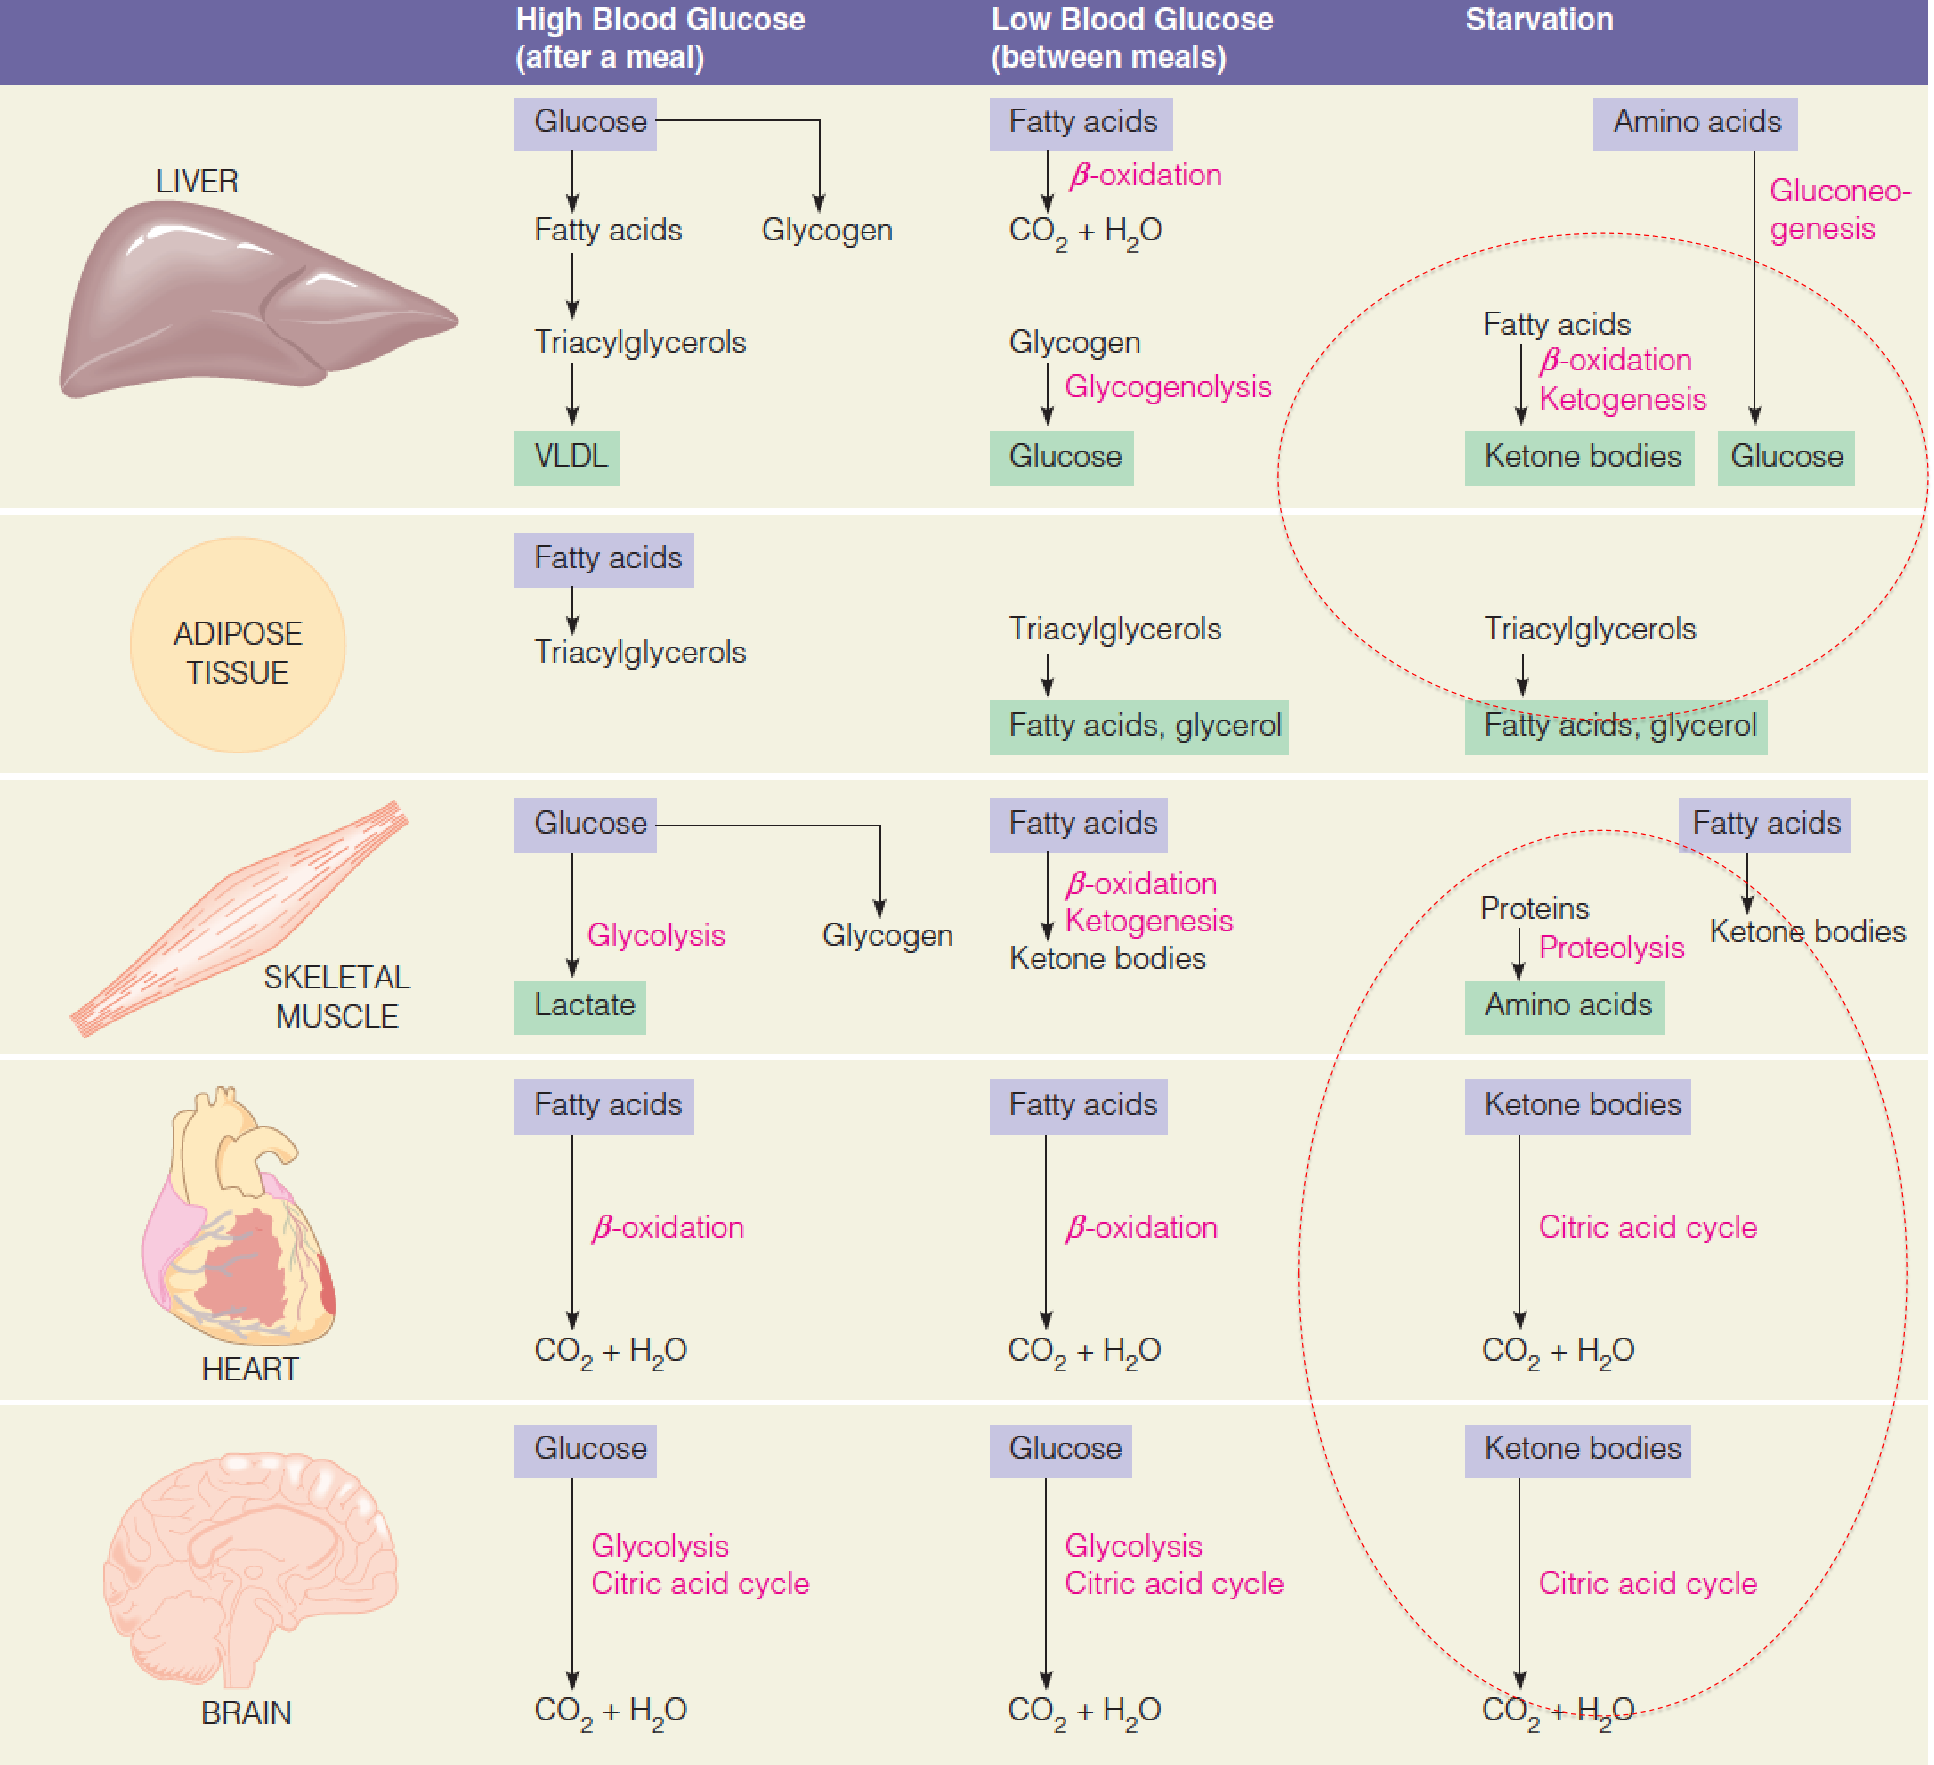
Metabolic interactions among the major fuel-metabolizing organs
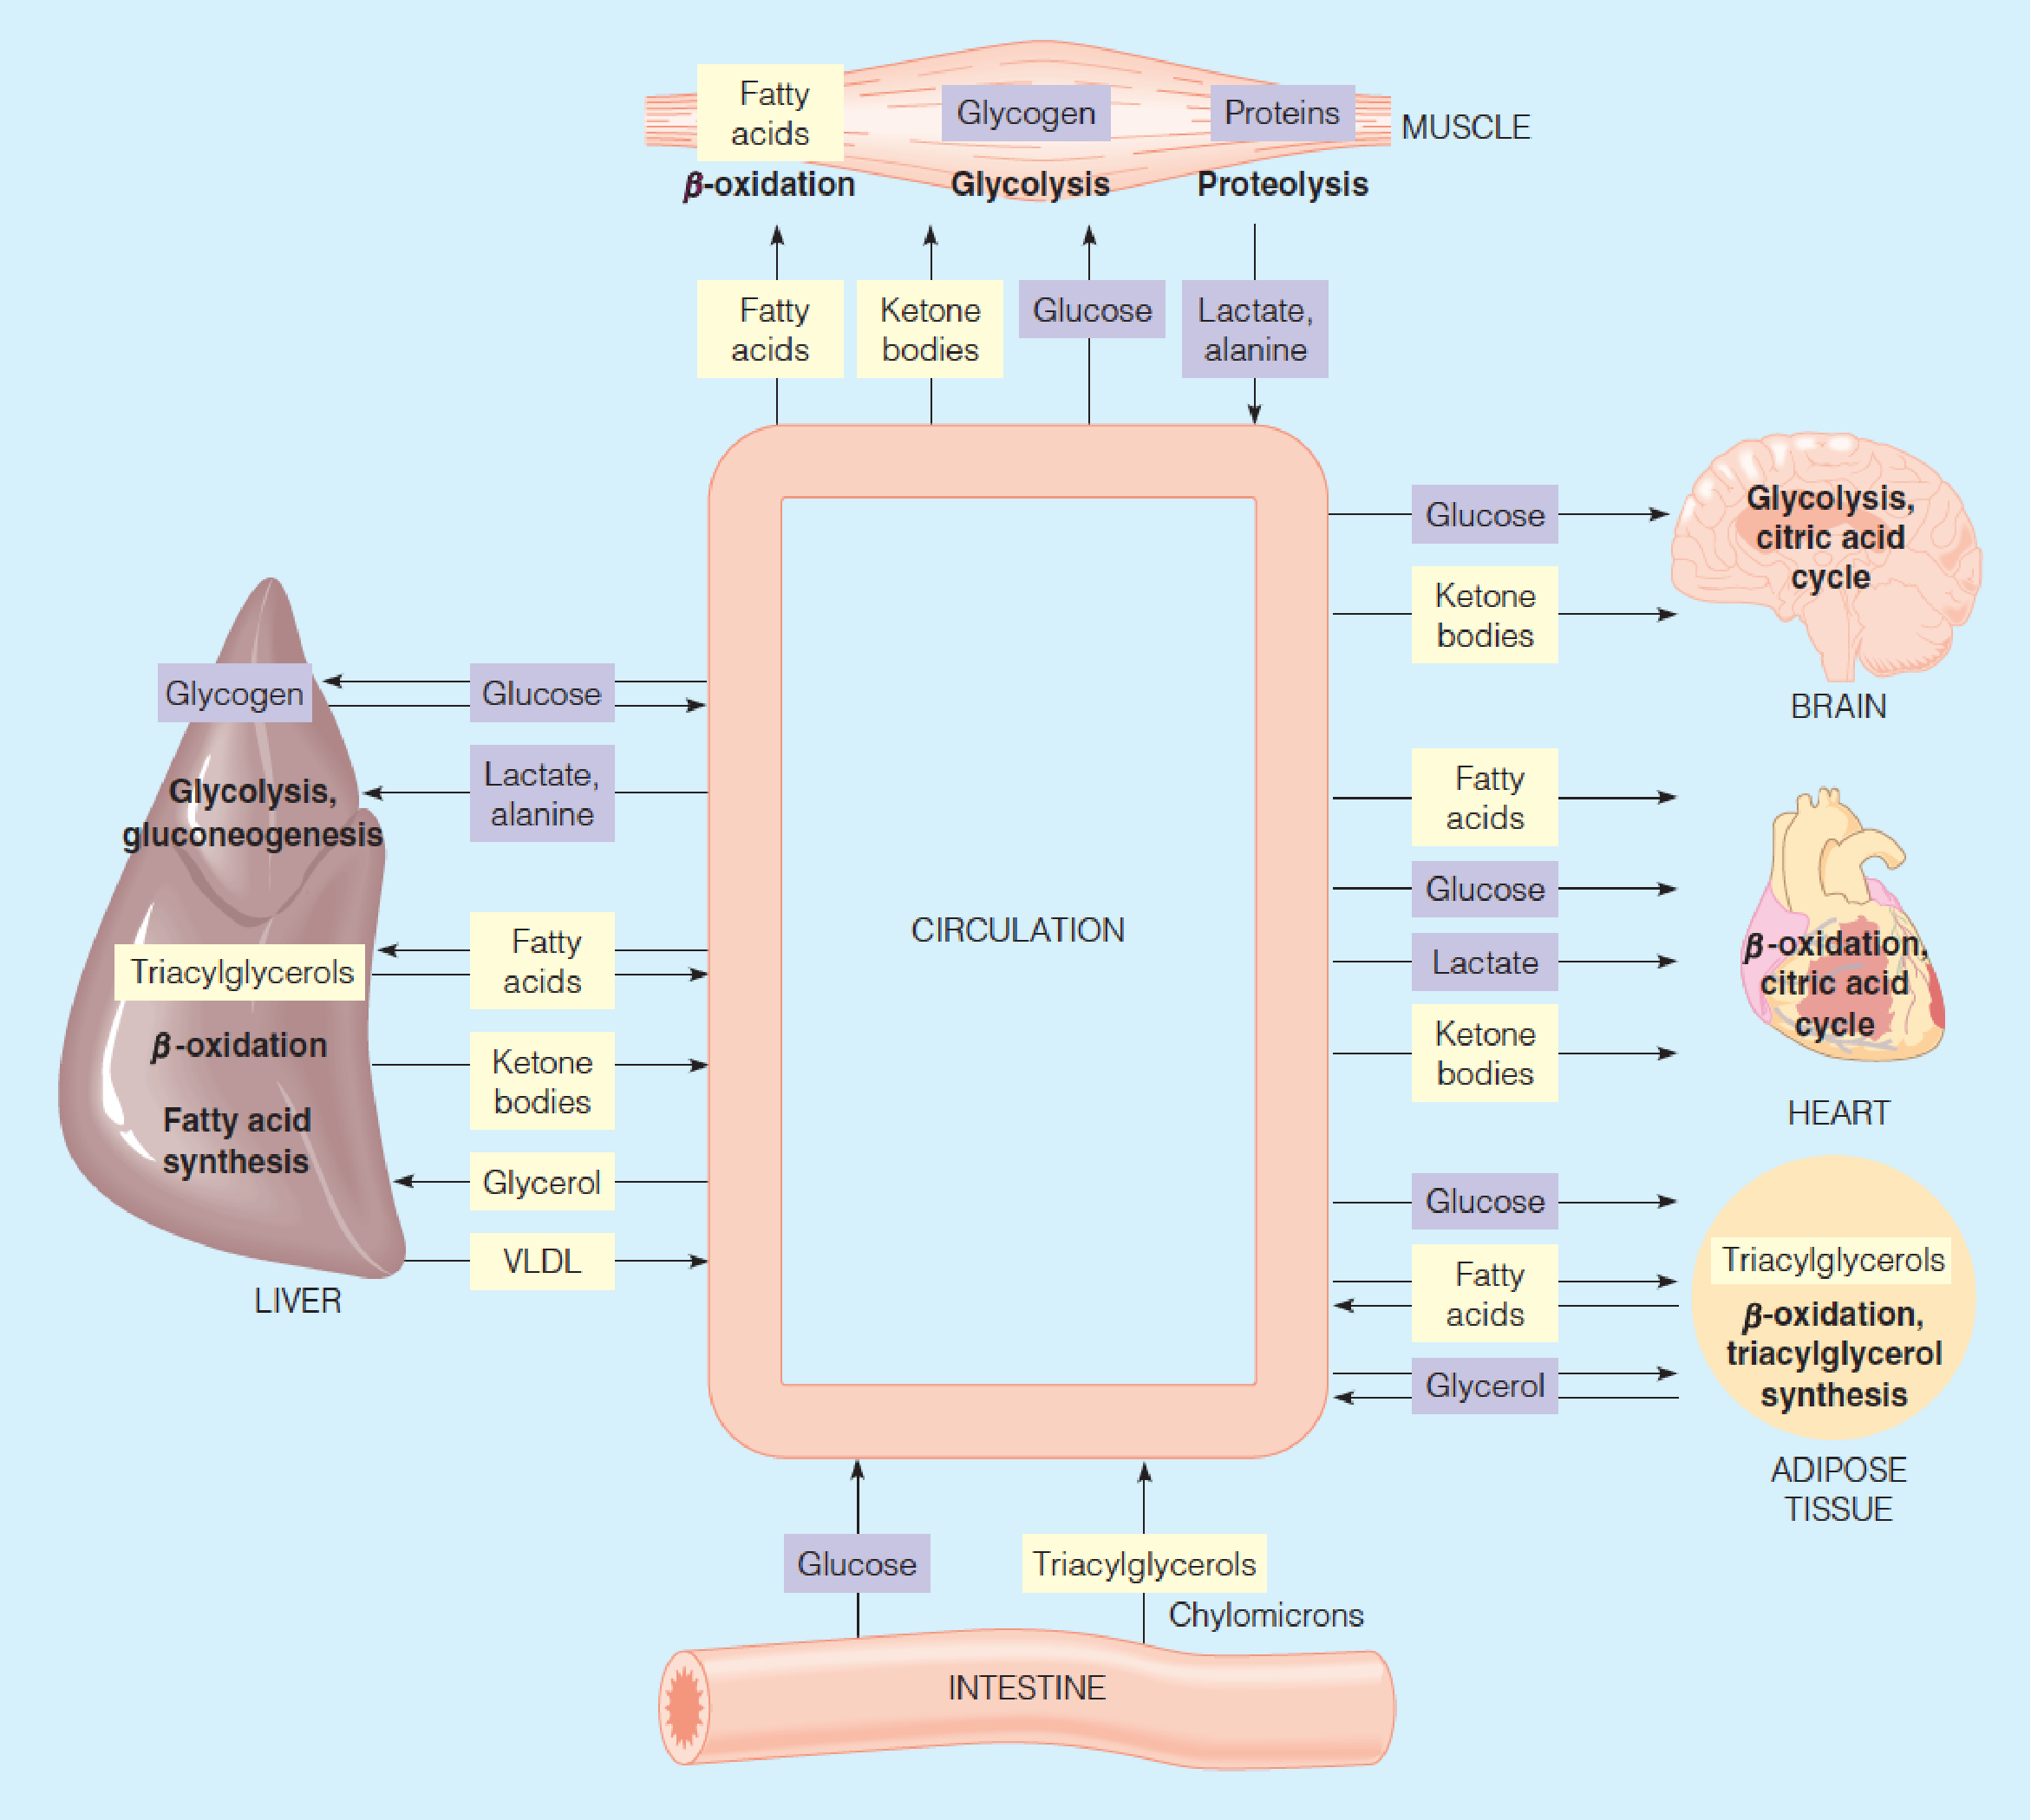
- Yellow: lipid-derived metabolites
- Blue: carbohydrate-derived metabolites
1. Brain
The most fastidious(过分挑剔的), it must use ATP in large quantities to maintain the membrane potentials essential for transmission of nerve impulses;
Under normal conditions, use only glucose to meet its prodigious energy requirement, which accounts about 60% of the glucose utilization of a human at rest (about 120 grams of glucose per day, 1700 kJ, about 15% of the total energy consumed by one person);
The brain’s quantitative requirement for glucose remains quite constant, even when an animal is at rest or asleep;
The brain is a highly aerobic organ, 20% of the total oxygen consumed by a human;
The brain has no significant glucose or other fuel reserves, the supply of both oxygen and glucose cannot be interrupted, even for a short time. Otherwise, irreversible brain damage results;
- No fuel reserve, therefore highly depends on external fuel molecule transport
- However, the brain can adapt during starvation to use ketone bodies instead of glucose as major fuel.
2. Muscle
Muscle can utilize a variety of fuel-glucose, fatty acids, and ketone bodies;
Skeletal muscle varies widely in its energy demands and fuels it consumes, in line with its wide variations in activity;
In resting muscle, fatty acids –major energy source; during exertion, glucose is the primary source;
Early in a period of exertion, that glucose comes from mobilization of the muscle’s glycogen reserves. Later, as glycogen reserves are depleted, fatty acids become the dominant fuel;
Skeletal muscle stores about three-fourths of the total glycogen in humans, with most of the rest being stored in the liver;
Muscle lacks the enzyme glucose-6-phosphatase, so glucose phosphate derived from glycogen cannot be converted to free glucose for export-they are retained for use by the muscle cells. Therefore, glucose phosphate produced from muscle glycogen cannot be released for use by other tissues; (Gluconeogenesis bypass 3 cannot occur)
- muscle cell 缺少 glucose-6-phosphatase, 使得glucose不能运出cell,从而导致glucose只进不出
During exertion, the flux rate through glycolysis exceeds that through the citric acid cycle, so lactate accumulates and is released;
Another metabolic product is alanine, produced via transamination from pyruvate in the glucose-alanine cycle;
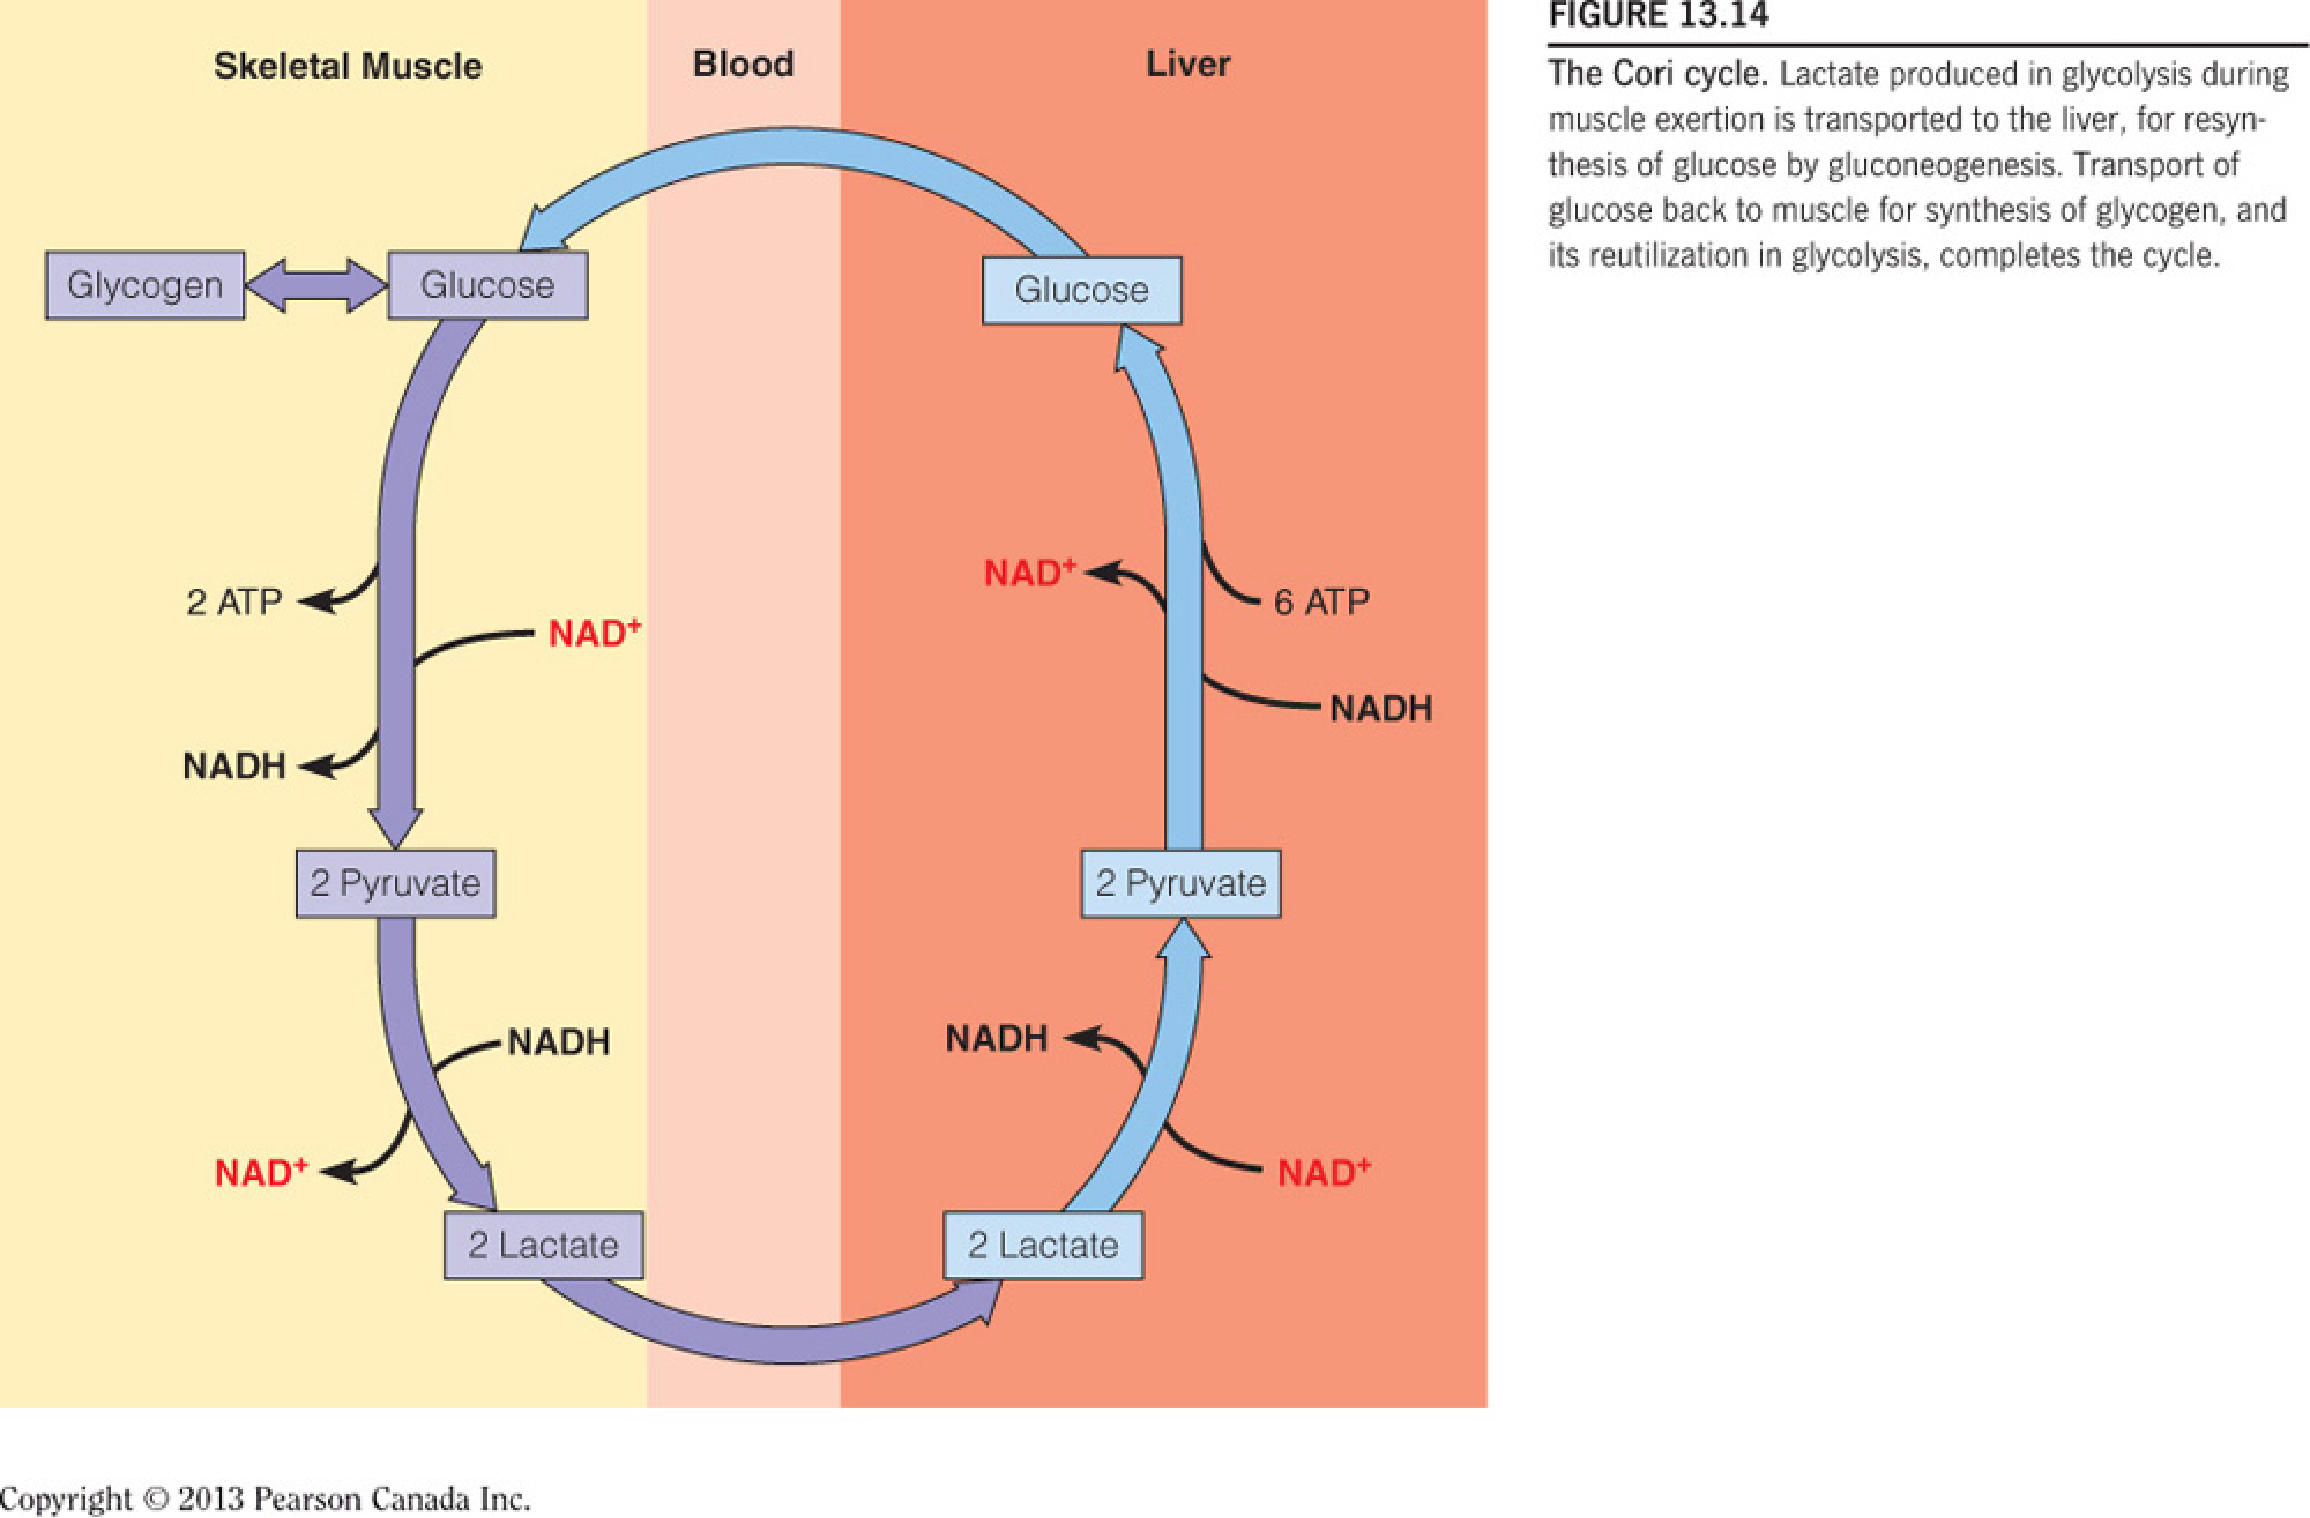
Both lactate and alanine are transported through the bloodstream to the liver, where they are reconverted through glyconeogenesis to glucose, for return to the muscle and other tissues by the Cori cycle; However, the major fate of lactate during exertion is uptake by the heart for use as fuel, via oxidation to CO2;
Muscle contains another readily mobilizable source of energy—its own protein. However, the breakdown of muscle protein to meet energy needs is both energetically wasteful and harmful to an animal, which needs its muscle to move around in order to survive. Protein breakdown is regulated to minimize amino acid catabolism except in starvation.
Muscle had additional energy reserve in creatine phosphate (磷酸肌酸), which generates ATP without the need for metabolizing fuels. This reserve is exhausted early in a period of exertion and must be replenished, along with glycogen stores, as muscle rests after prolonged exertion.
Cori Cycle
Glucose-Alanine Cycle
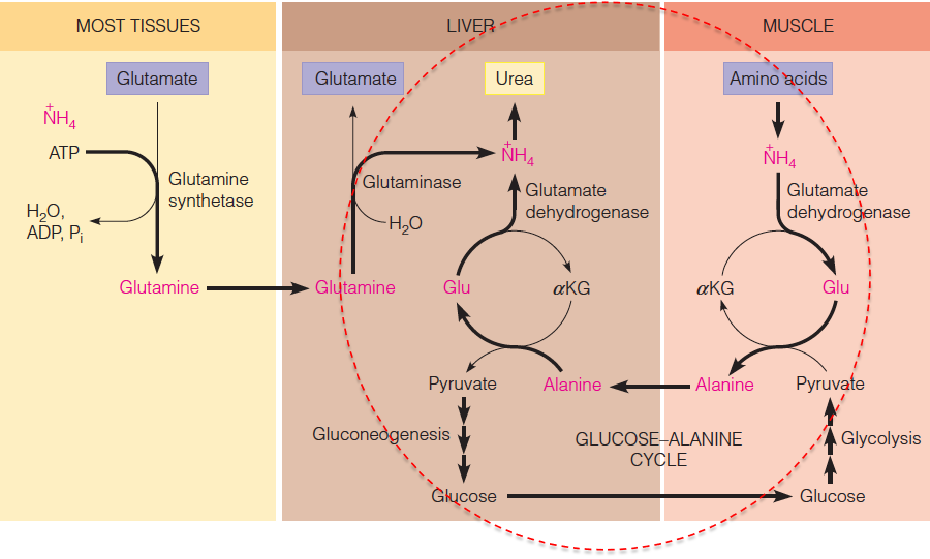
- Transport of ammonia (toxic) from the muscle to liver for urea synthesis
- 蛋白质代谢产生的产物之一是氨
3. Heart
The metabolism of heart muscle differs from that of skeletal muscle in three important aspects:
- Work output is far less variable than in skeletal muscle;
- The heart is a completely aerobic tissue, while skeletal muscle can function anaerobically for limited periods. Mitochondria are much more densely packed in heart than in other cells, making up nearly half the volume of a heart cell;
- The heart contains negligible energy reserve as glycogen or lipids, although there is a small amount of creatine phosphate. Therefore, supply of both oxygen and fuels from the blood must be continuous to meet the unending energy demands of the heart.
The heart uses a variety of fuels—mainly fatty acids but also glucose, lactate, and ketone bodies.
4. Adipose Tissue
Adipose tissue represents the major fuel depot for an animal. The total stored TG amount to some 555,000 kJ (133,000 Cal) in an average-sized human. This is enough fuel, to sustain life for several months in the absence of further caloric intake;
The adipocyte is designed for continuous synthesis and breakdown of TG, with breakdown controlled largely via the activation of hormone-sensitive triglyceride lipase;
Because adipocytes lack the enzyme glycerol kinase, some glucose catabolism must occur for TG synthesis to take place—specifically, the formation of dihydroxyacetone phosphate (DHAP), for reduction to glycerol-3-phosphate;
Glucose acts as a sensor in adipose tissue metabolism.
- Intracellular (adipocyte) glucose levels ↑ ➔ DHAP ↑ ➔ glycerol-3-phosphate ↑ ➔ TG synthesis ↑;
- Intracellular glucose levels ↓ ➔ DHAP ↓ ➔ glycerol-3-phosphate ↓ ➔ TG synthesis ↓.
5. Liver
Liver (I) - Metabolite Synthesis
A primary role of liver is the synthesis of fuel components for use by other organs. In fact, most of the low-molecular-weight metabolites that appear in the blood through digestion are taken up by the liver for this metabolic processing;
The liver is a major site for fatty acid synthesis; it also produces glucose, both from its own glycogen stores and from gluconeogenesis, the latter using lactate and alanine from muscle, glycerol from adipose tissue, and the amino acids not needed for protein synthesis; ketone bodies are also manufactured largely in the liver;
In liver, the level of malonyl-CoA is a determinant of the fate of fatty acyl-CoAs. When fuel is abundant↑ ➔ malonyl-CoA ↑ ➔ carnitine acyltransferase I (CPT1) ↓ ➔ transport of fatty acyl-CoAs into mitochondria ↓ ➔ β-oxidation ↓ and ketogenesis ↓ ;
When fuel is inadequate↓ ➔ malonyl-CoA ↓ ➔ carnitine acyltransferase I (CPT1) ↑ ➔ transport of fatty acyl-CoAs into mitochondria ↑ ➔ β-oxidation ↑ and ketogenesis ↑ .
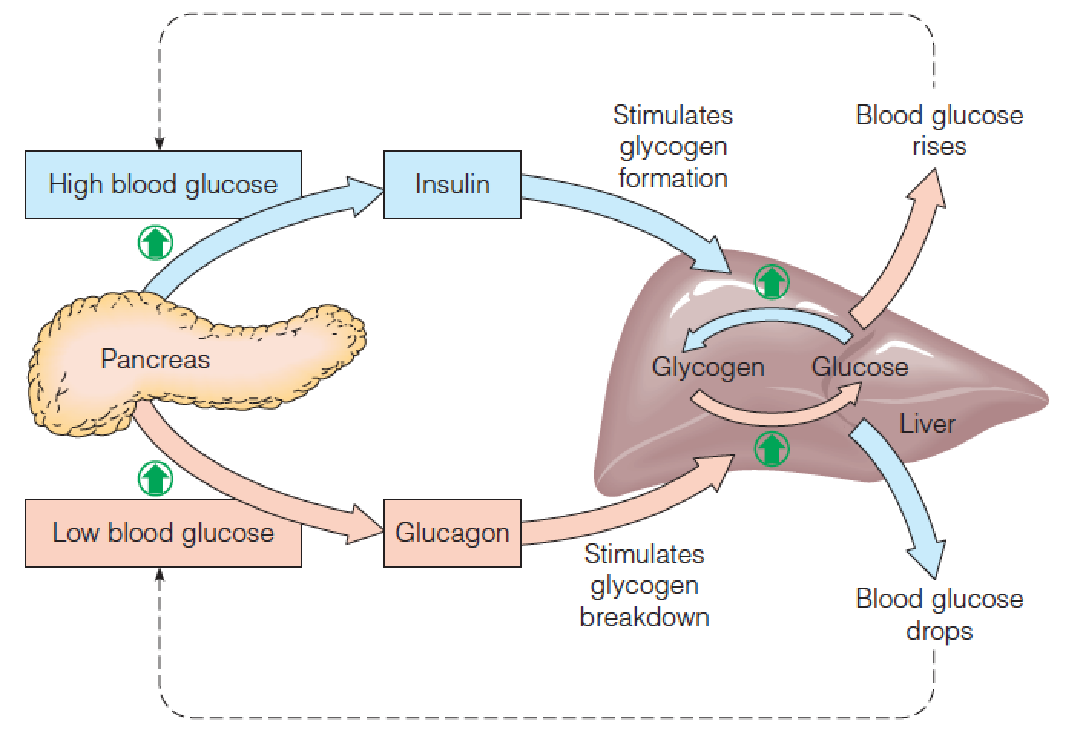
Liver (II) - Buffer Blood Glucose
An important role of liver is to buffer the level of blood glucose. It does this largely through the action of hexokinase IV (己糖激酶Ⅳ,previously called glucokinase (葡(萄)糖激酶)), an enzyme specific to liver, with a high K1/2 (about 7.5 mM) for glucose, and partly a high-Km transporter protein, the glucose transporter (GLUT2).
Thus, high blood glucose levels ↑ ➔ uptake and phosphorylation of glucose ↑ ➔ glycogen systhesis ↑;
Glucose-6-phosphate accumulation ↑ ➔ activates the β form of glycogen synthase ↑;
Glucose itself binds to glycogen phosphorylase a, increases its dephosphorylation and results in inactivation ↓ ;
Thus, liver senses the fed state and acts to store fuel derived from glucose. Liver also senses the fasted state and increase the synthesis and export of glucose when blood glucose levels are low.
The liver can use a variety of fuel sources, including glucose, fatty acids, and amino acids.
6. Blood
All the organs are connected by the bloodstream, which transport what may be one organ’s waste product but another organ’s fuel
- Blood transport O2 and CO2
- Lipoprotein: CM and VLDL
- RBC: no mitochondria, depend exclusively upon anaerobic glycolysis to their limited energy needs
二、Hormonal Regulation of Fuel Metabolism
Maintenance of blood glucose within narrow limits is critical to brain function.
One of the most important roles of liver is to serve as a “glucostat (葡萄糖调节剂)” monitoring and stabilizing blood glucose levels.
The key hormones regulating fuel metabolism are insulin, which promotes glucose use, and glucagon and epinephrine, which increase blood glucose.
- Several hours after a meal: 80 mg/100 ml or 4.4 mM; Shortly after the meal: 120 mg/100 ml, 6.6 mM, uptake by cells;
- Islets of Langerhans (胰岛;郎格罕氏岛) contain at least five different cell types, each specialized for synthesis of one hormone:
- the $\alpha$ (or A) cells produce glucagon(胰高血糖素);
- the $\delta$ (or D) cells, somatostatin(生长激素抑制素);
- the $\epsilon$ cells, ghrelin(生长素释放肽);
- the F cells, pancreatic polypeptide;
- $\beta$ (or B) cells, insulin(胰岛素).
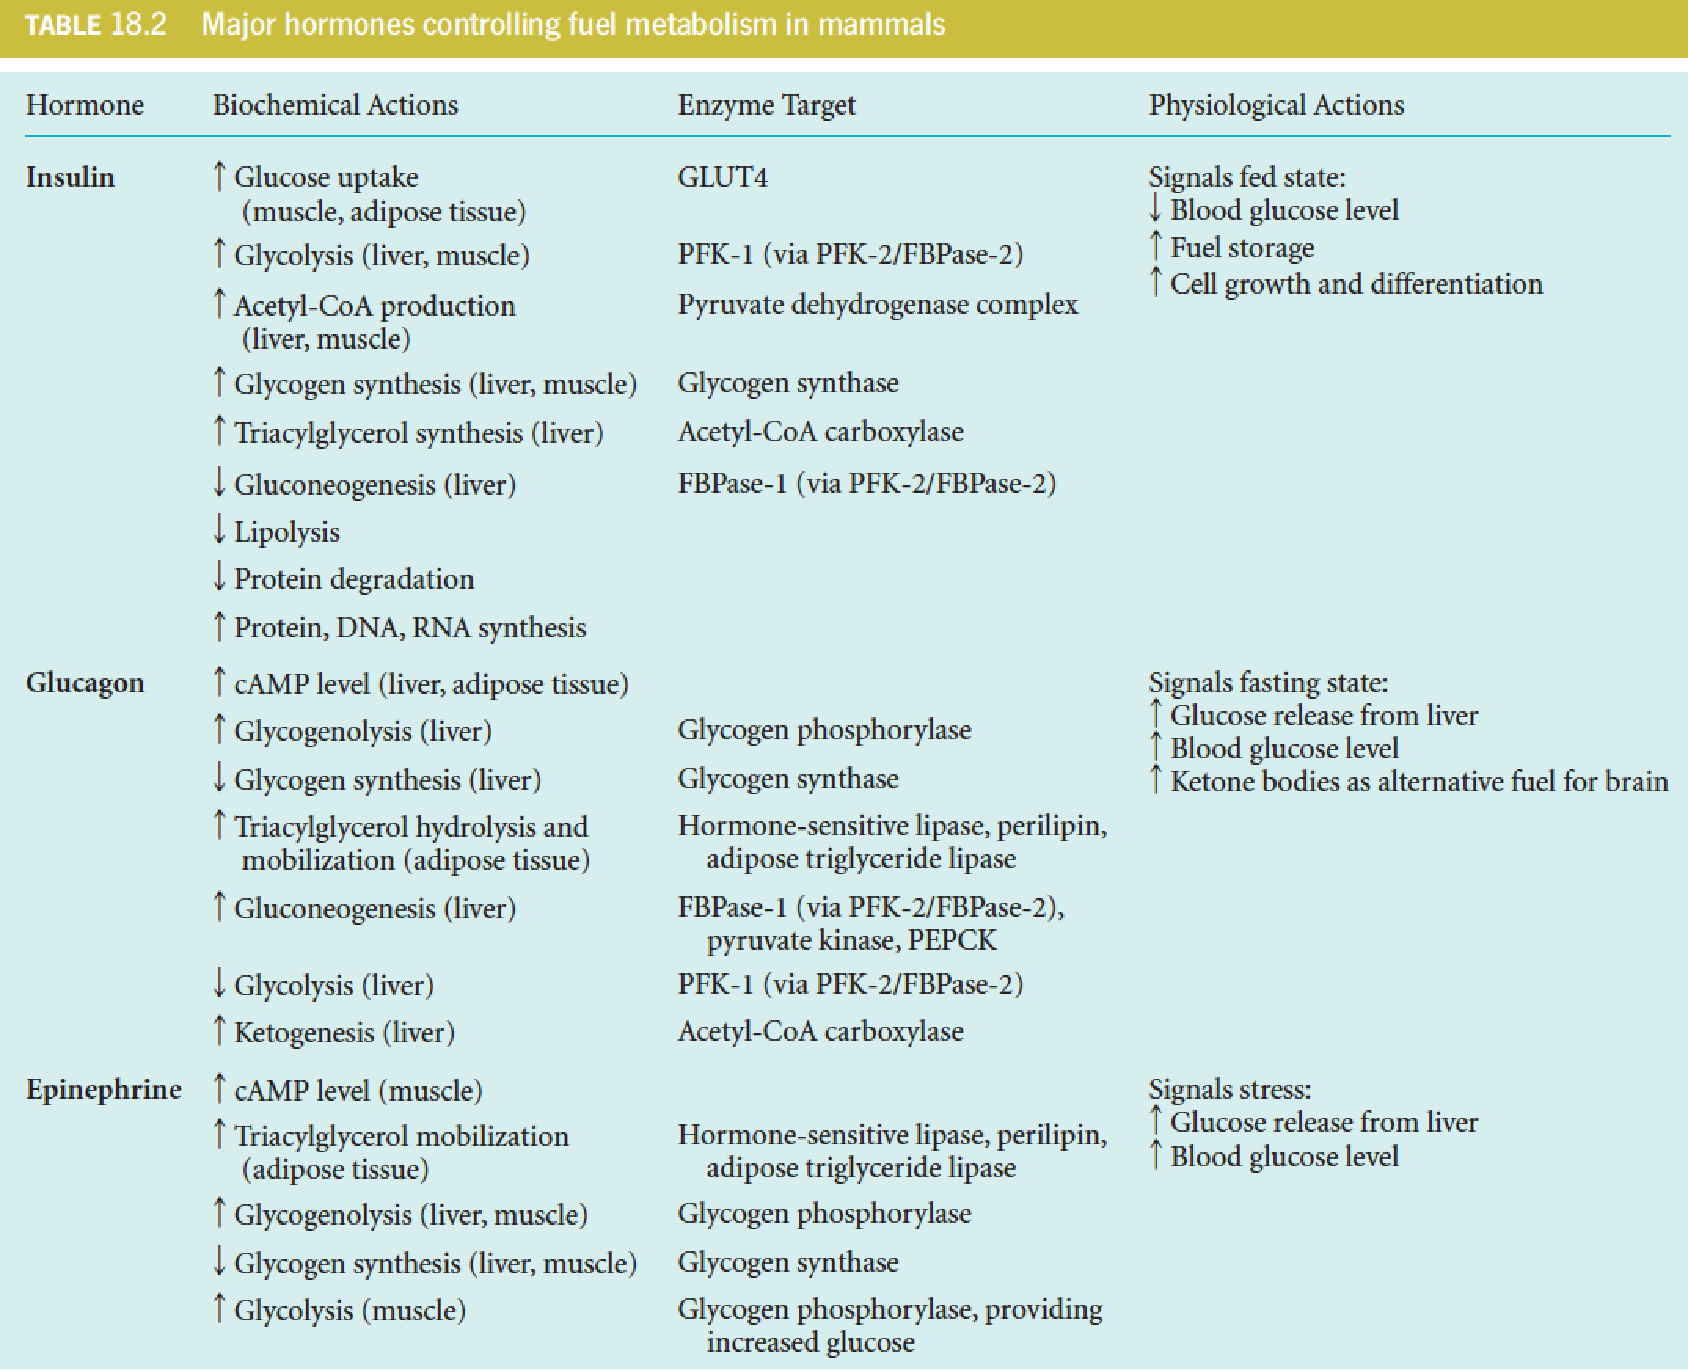
Insulin regulation of fuel metabolism
Insulin signals the fed state and thereby promotes
- uptake of fuel substrates into some cells,
- storage of fuels (lipids and glycogen),
- biosynthesis of macromolecules (nucleic acids and protein);
The specific effects include:
- increased uptake of glucose in muscle and adipose tissue;
- activation of glycolysis in liver;
- increased synthesis of fatty acids and TG in liver and adipose tissue;
- inhibition of gluconeogenesis in liver;
- increased glycogen synthesis in liver and muscle;
- increased uptake of amino acids into muscle with consequent activation of muscle protein synthesis;
- inhibition of protein degradation;
- cell growth-promoting effect.
Because of its promotion of biosynthesis, it is appropriate to consider insulin a growth hormone.
1. Glucose promote insulin release from the beta cells
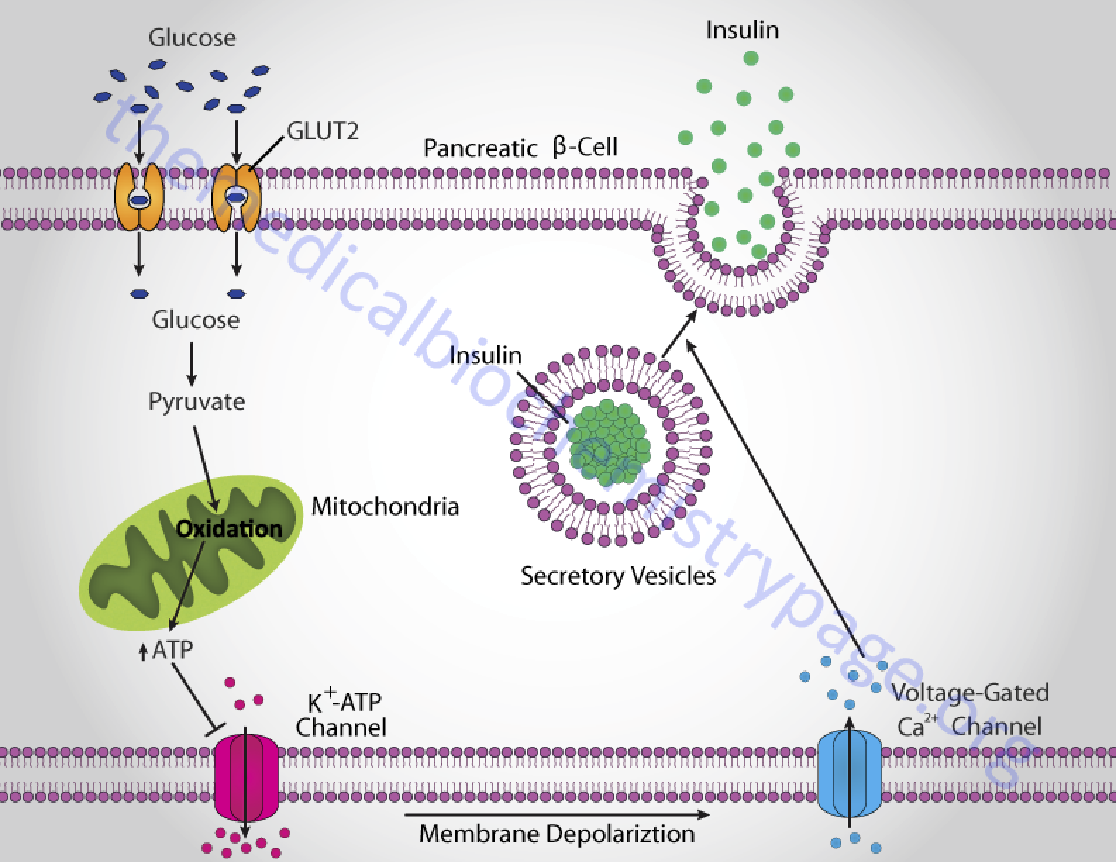
How β cells release insulin
The β cells take up and catabolize glucose ↑ ➔ ATP levels ↑ ➔ closure of ATP-gated K+ channels and depolarization of the plasma membrane ↑ ➔ cytosolic [Ca2+] ↑ ➔ triggers exocytosis of insulin granules ↑.
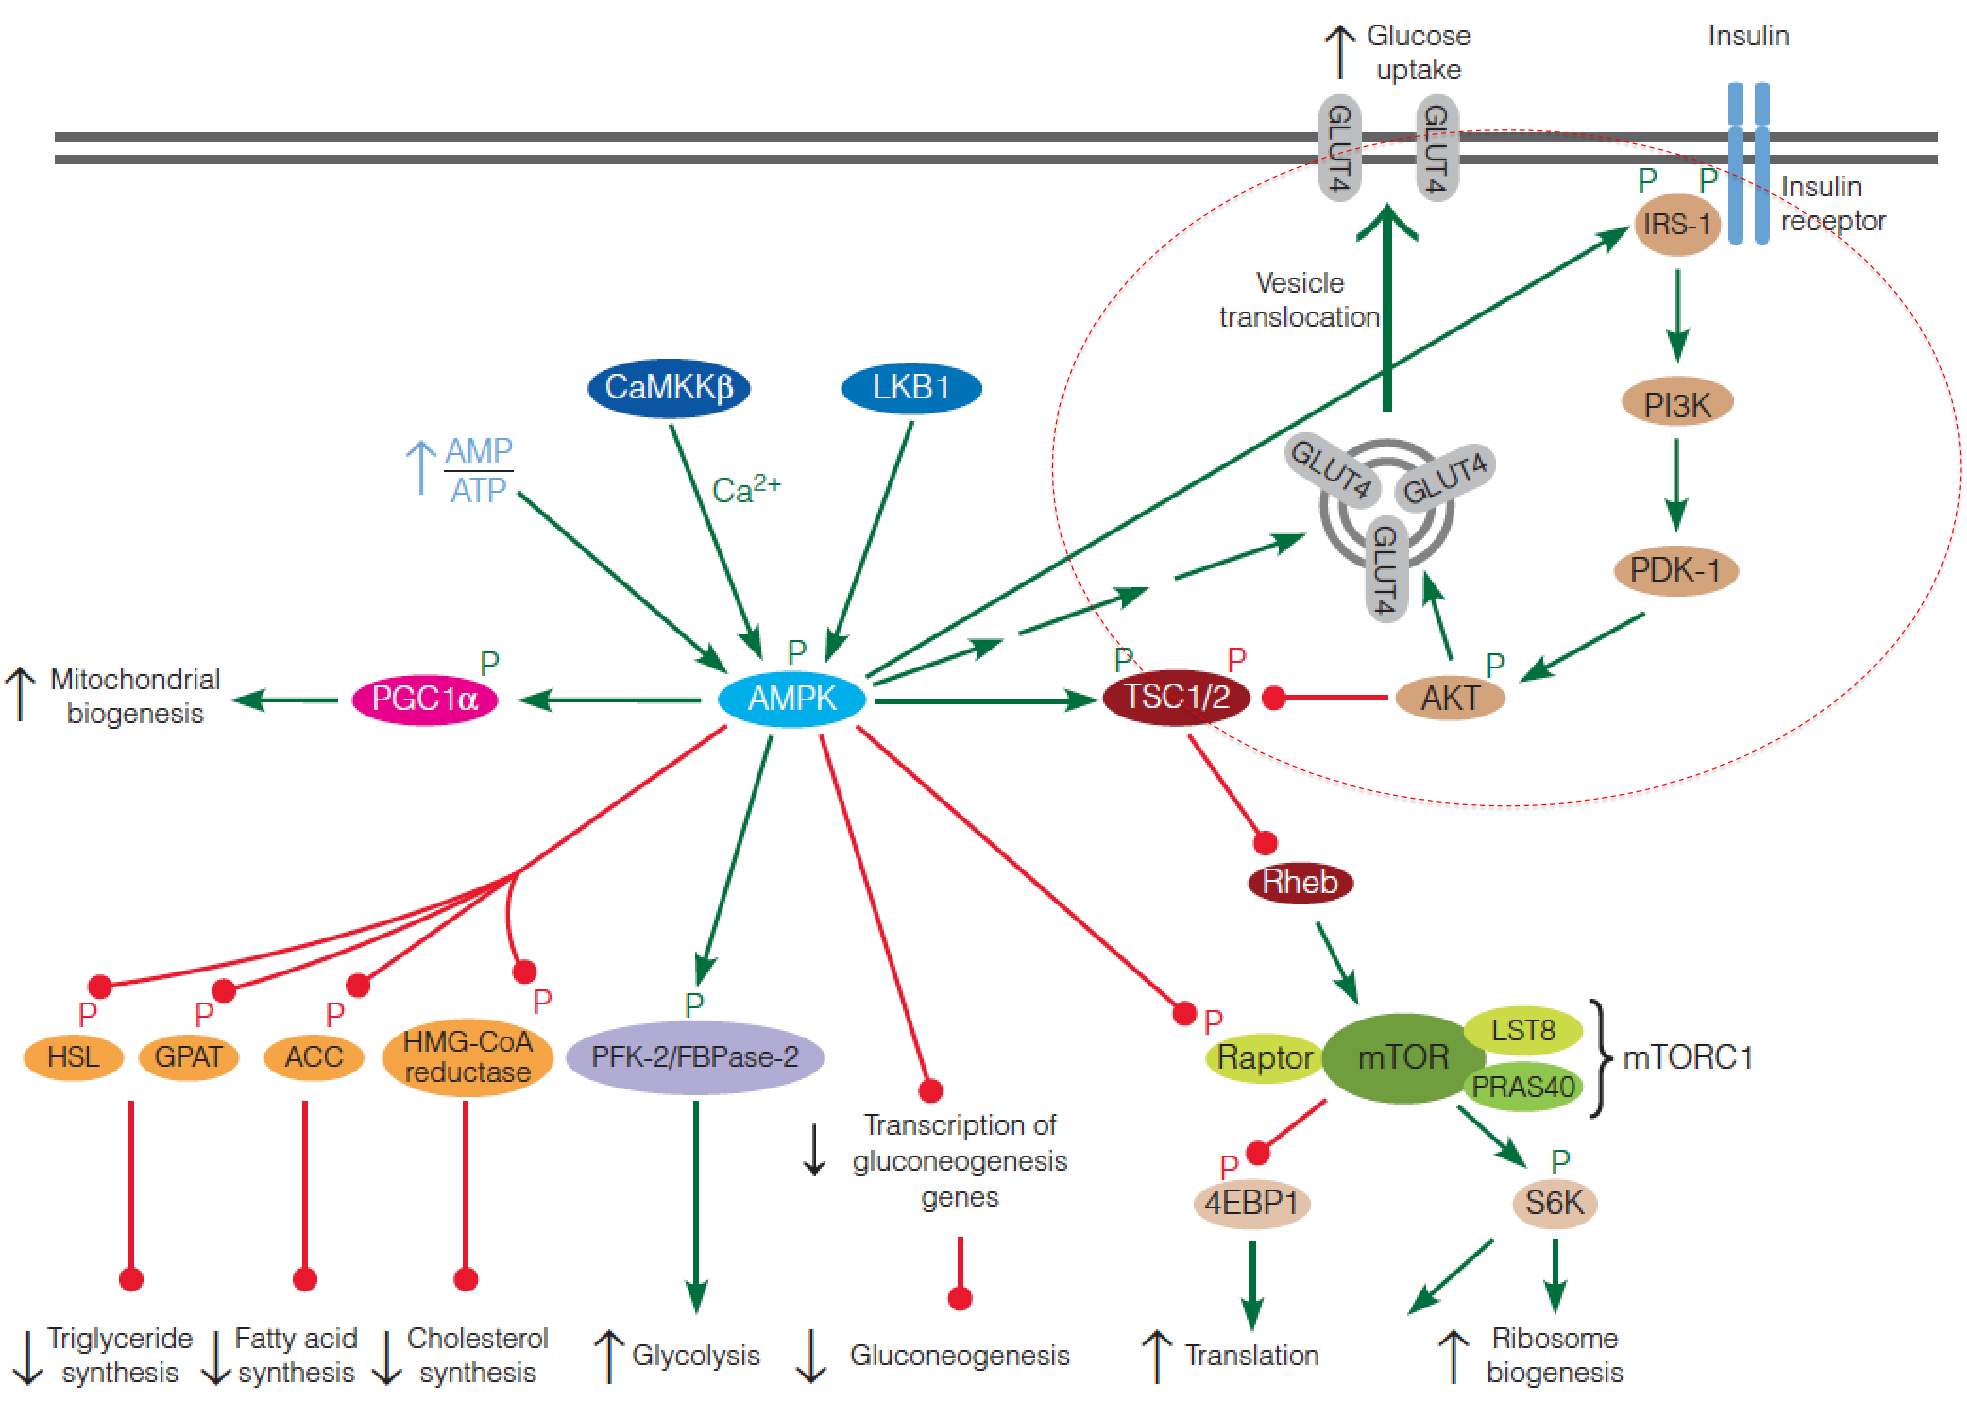
The ovweview of Insulin regulation pathway
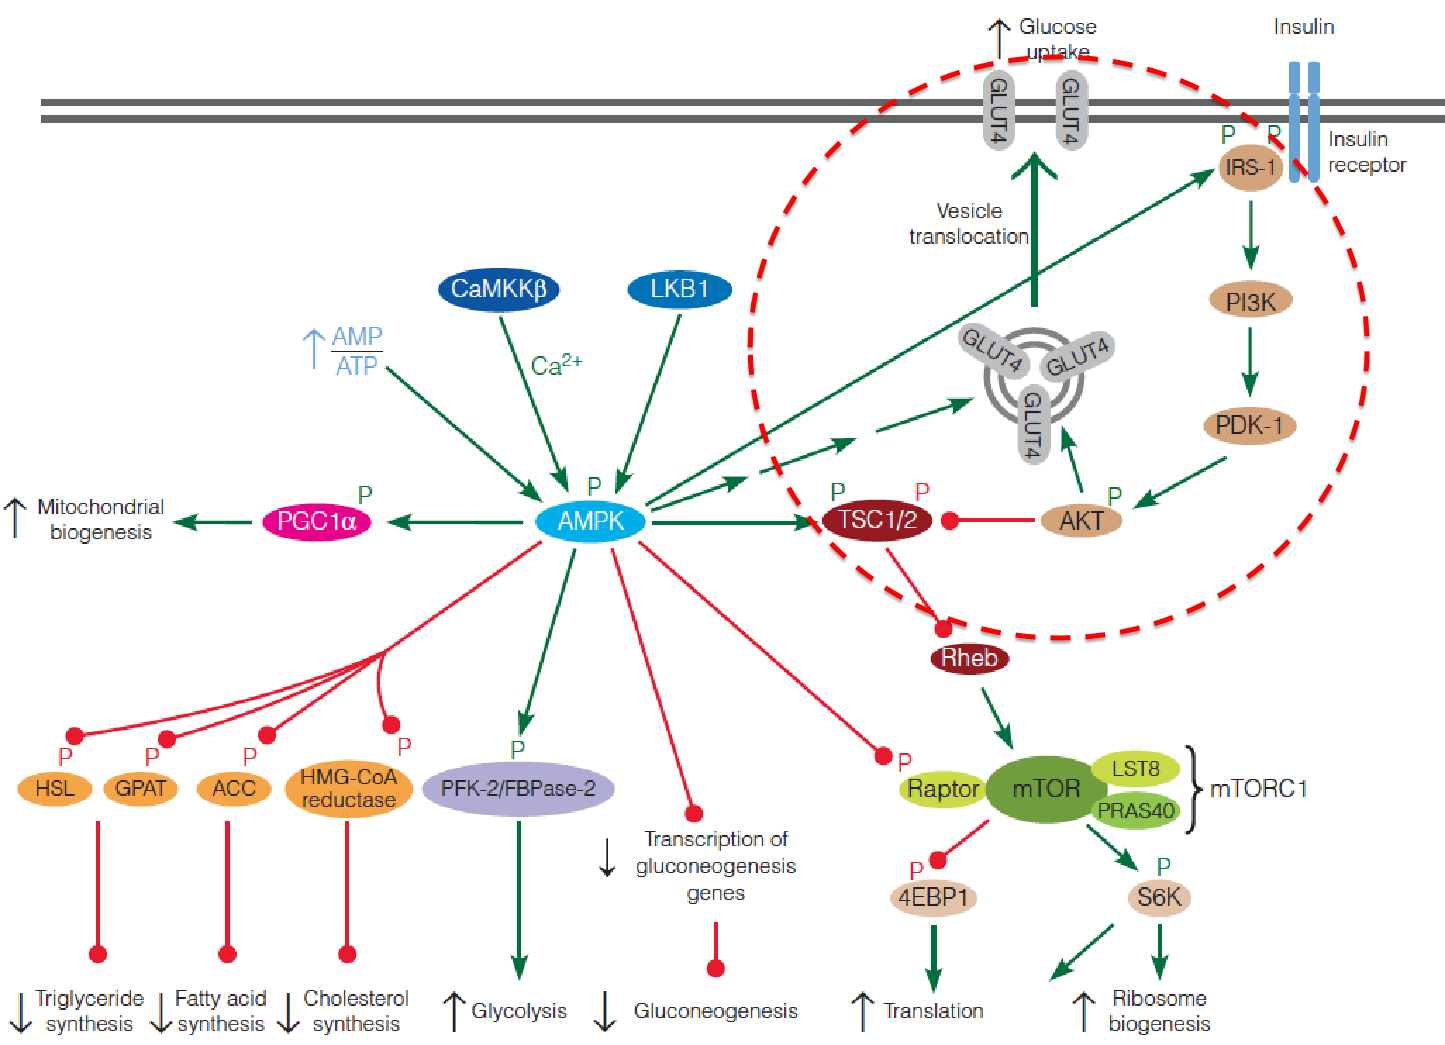
- 4EBP1: eukaryotic initiation 4E-binding protein
- S6K: ribosomal protein S6 kinase
- LKB1: Liver kinase B1
- CaMKKb:Ca2+/calmodulin-dependent protein kinase kinase b
- IRS: insulin receptor substrate
- PGC-1: peroxisome proliferator-activated receptor-gamma coactivator 1
- TSC: tuberous sclerosis complex
- PI3K: phosphoinositide 3-kinase
2. Insulin facilitate glucose uptake into muscle and adipose cells
The mechanism by which insulin stimulates glucose uptake into muscle and adipose cells in an area of intense investigation;
One important action involves the glucose transporter, GLUT4. Before stimulation by insulin, this transporter is not present on the cell surface; rather, it is localized in vesicles in the cytosol. The protein is translocated to the cell surface in response to insulin, where it facilitates glucose uptake.
An important consequence of glucose uptake in adipocytes is its conversion to glycerol-3-phosphate, which combines with fatty acids to stimulate TG synthesis.
3. Actions of glucagon in liver that lead to a rise in blood glucose
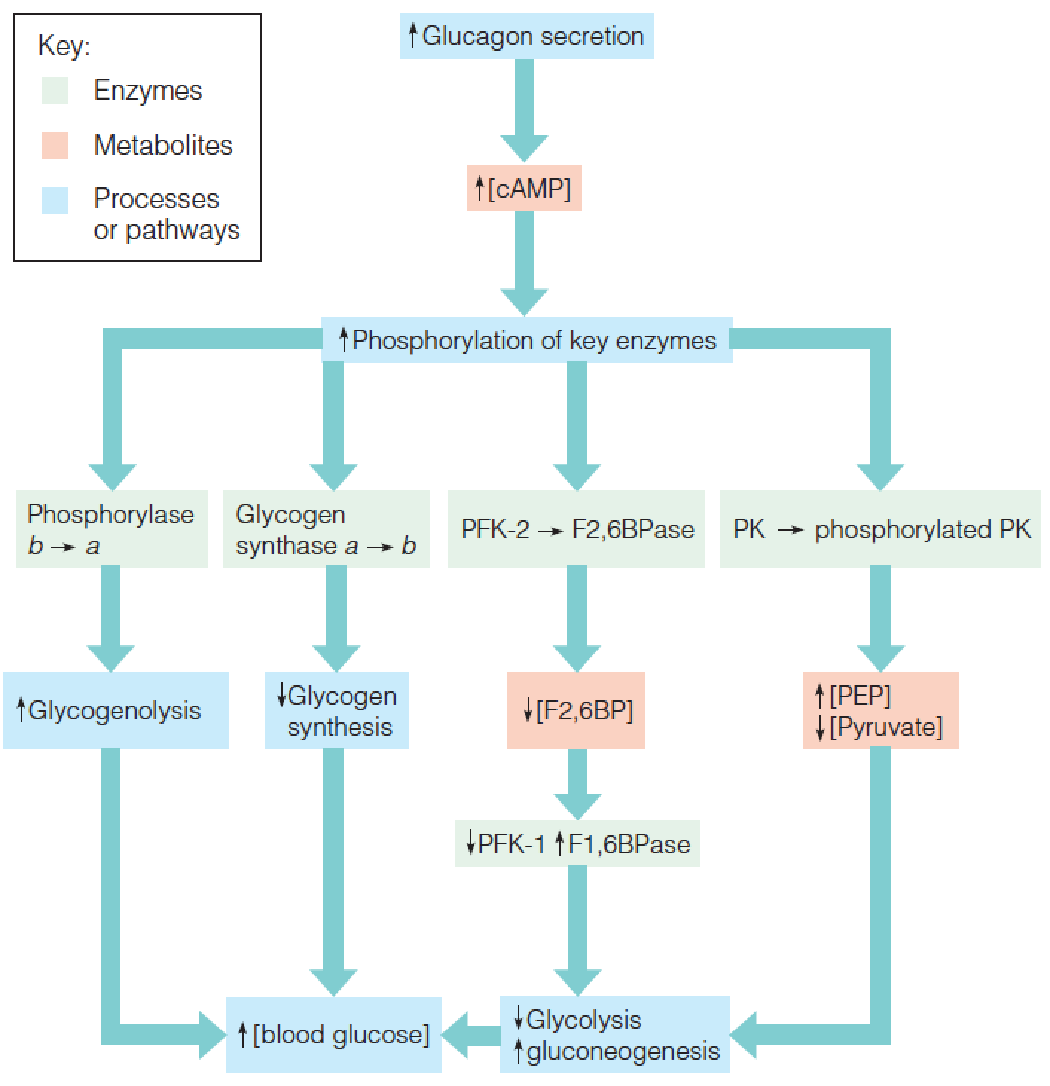
- The primary target of glucagon is the liver, and its principal effect is to increase cyclic AMP levels in liver cells.
- PFK: phosphofructokinase
- PK: pyruvate kinase
- F2,6BP: β-D-Fructose-2,6-bisphosphate
- PEP: phosphoenolpyruvate
A 3.5 kDa polypeptide
Produced by alpha-cells (α-cells); sense blood sugar; release in response to low blood sugar.
4. Actions of glucagon in adipose cells
Control of lipolysis in adipose cells by a cAMP-mediated cascade system:
Hormonal activation of a β–adrenergic G-protein coupled receptor (GPCR) on the plasma membrane leads to elevation of cAMP levels, which in turn, activates protein kinase A (PKA). PKA phosphorylates perilipin (PL, 周脂素) and hormone-sensitive lipase ( HSL, 激素敏感性脂肪酶).
PL and HSL are phosphorylated.
CGI-58 dissociates from phosphorylated-PL, and binds ATGL.
Phosphorylated HSL is recruited to the lipid droplet and activated by phosphorylated-PL.
Phosphorylated-PL also recruits the ATGL/CGI-58 complex to the lipid droplet, activating this lipase.
Activated ATGL hydrolyzes TG to activated HSL hydrolyzes DG to cytoplasmic MGL hydrolyzes MG to free glycerol + FFA.
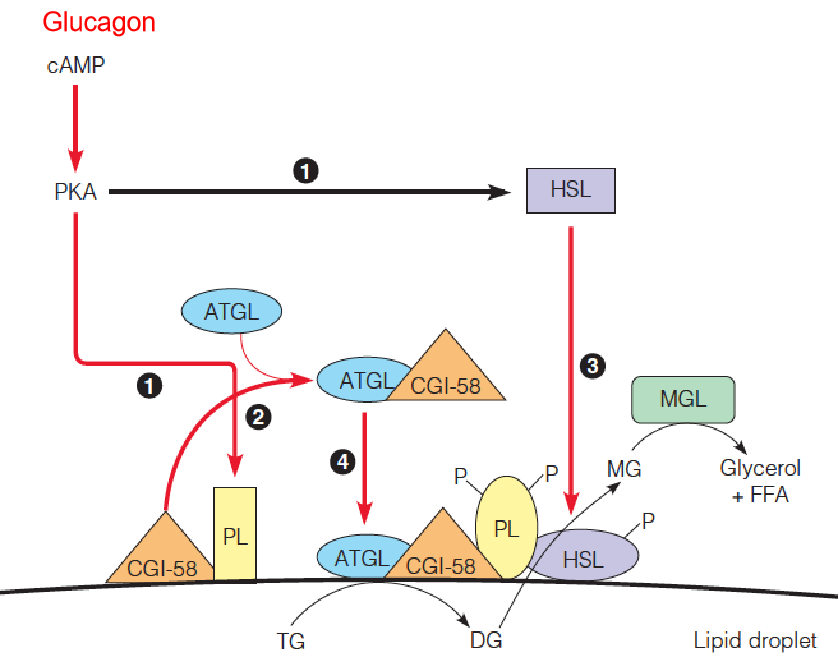
- HSL: hormone-sensitive lipase
- CGI-58: comparative gene identification-58CGI
- ATGL: adipose triglyceride lipase
- DG: diacylglycerol
- MGL: monoglyceride lipase
In adipose tissue, glucagon also increases cAMP. There the chief effect of cAMP is to promote TAG mobilization via phosphorylation of hormone-sensitive lipase and perilipin, yielding glycerol and fatty acids.
Epinephrine
The catecholamines (儿茶酚胺) epinephrine (肾上腺素) and norepinephrine (去甲肾上腺素), when released from presynaptic nerve endings, function as neurotransmitters;
When released from adrenal medulla in response to low blood glucose levels, epinephrine interacts with second-messenger systems in many tissues, with varied effects;
In muscle, epinephrine activates adenylate cyclase with concomitant(伴随的) activation of glycolysis and inhibition of glycogen synthesis; TG breakdown in adipose tissue is also stimulated, providing fuel for the muscle tissue;
Inhibits insulin secretion and stimulates glucagon secretion; increases glucose production and release by the liver, the net result is to increase blood glucose levels;
Unlike glucagon, the catecholamines have short-lived metabolic effects.
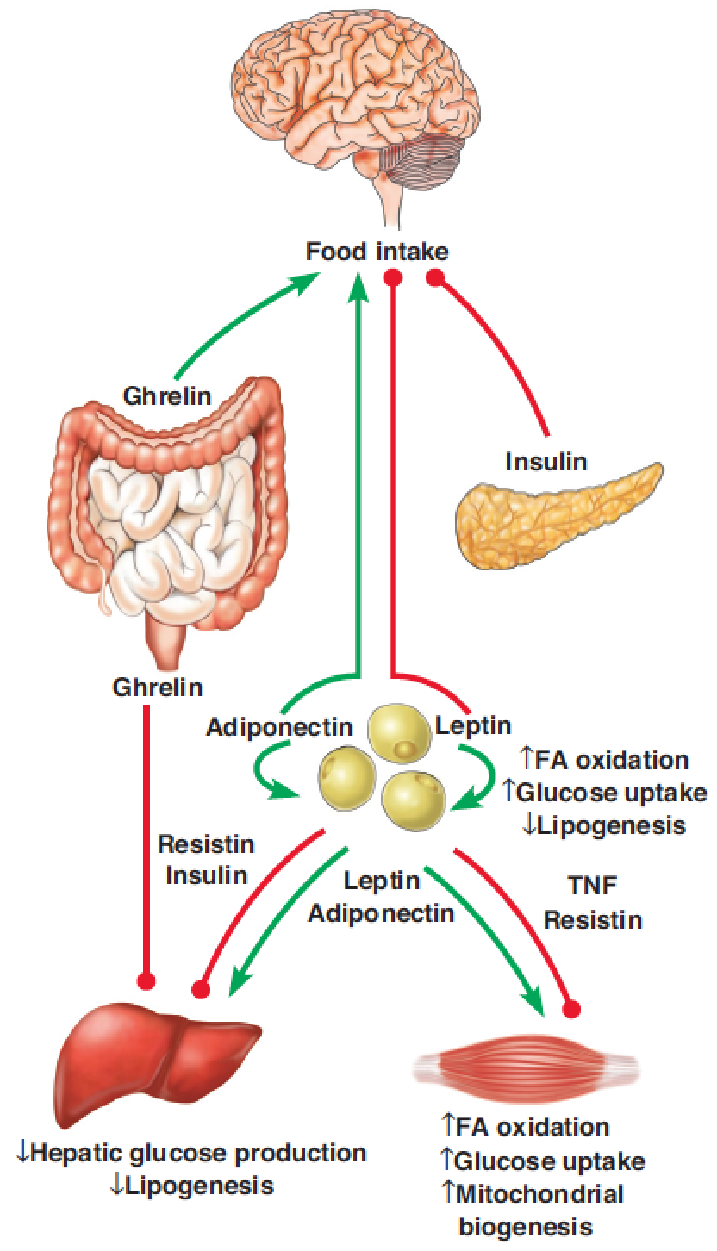
1. Endocrine regulation of food intake and energy homeostasis in mammals
The effects of the major endocrine regulators on AMPK signaling in brain, adipose tissue, liver, and skeletal muscle.
Coordination of Energy Homeostasis
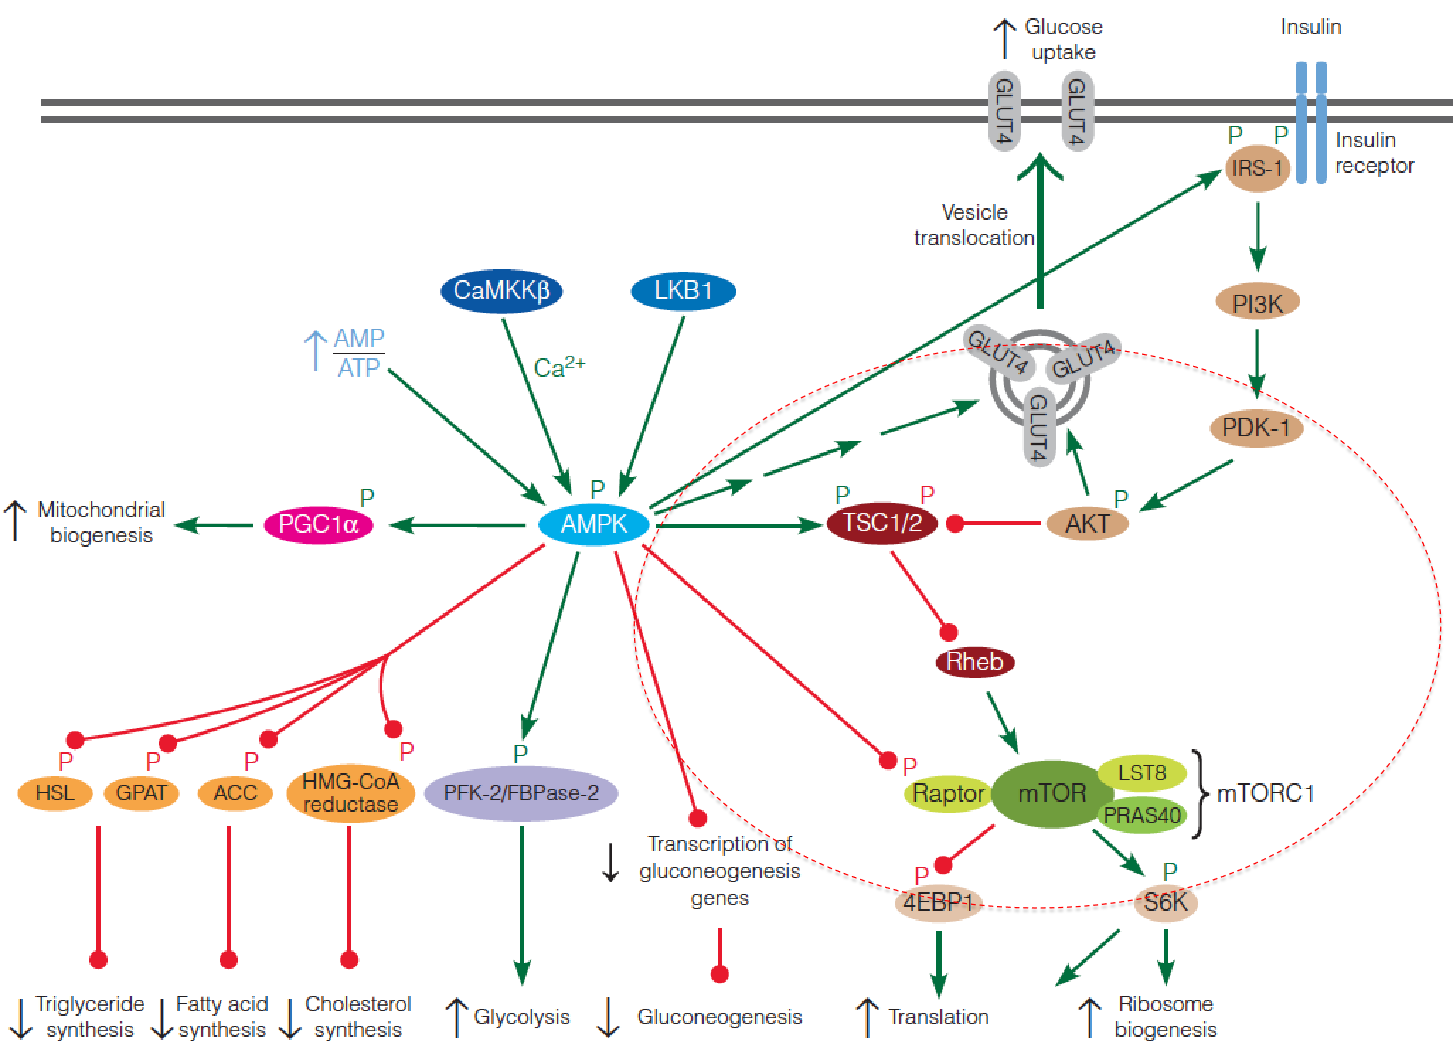
AMPK ( AMP-activated protein kinase ) and mTOR (mammalian target of rapamycin) protein kinases play central roles in orchestrating the metabolic activity of mammalian cells.
AMPK is activated when the energy charge of the cell is low.
Mammalian AMP-activated protein kinase (AMPK):
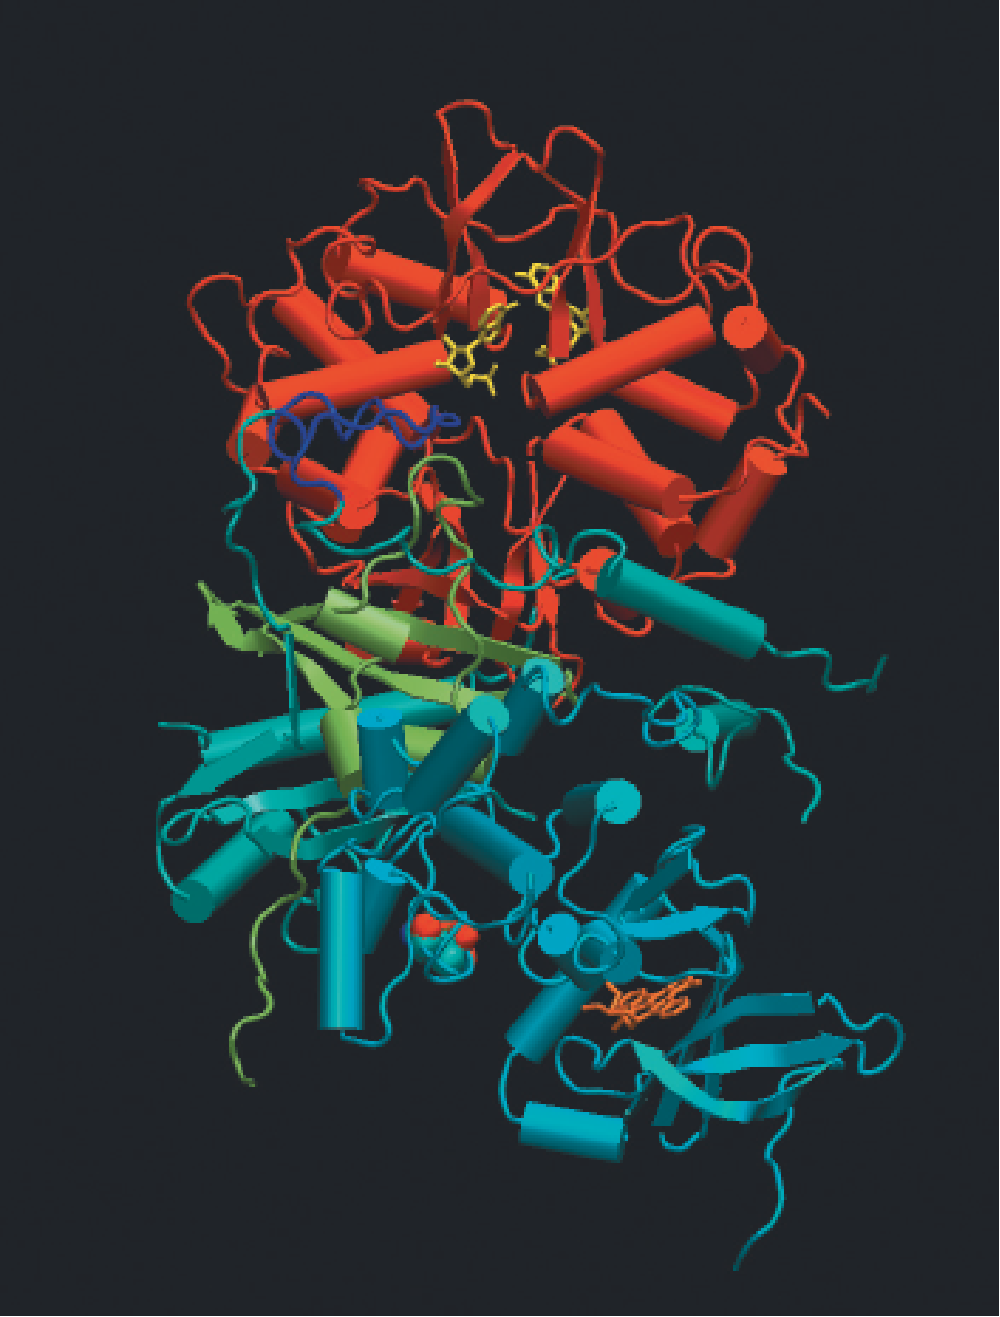
- X-ray crystal structure of the heterotrimeric enzyme (AMPK)
- Green arrow: activation of AMPK
- Red cycles: inhibition of AMPK
1. AMP-Activated Protein Kinase (AMPK)
AMPK, serine/threonine protein kinase, found in all eukaryotes, is activated when the energy charge of the cell is low (i.e., high AMP:ATP ratio);
- 在机体内部缺少能量的时候,AMPK被激活
AMP:ATP ratio ↑(nutrient starvation or hypoxia(氧不足)) ➔ AMPK ↑ ➔ pathways that lead to ATP production ↑; pathways that utilize ATP ↓ ➔ATP production ↑;
- AMPK: heterotrimer, a catalytic subunit ($\alpha$) and two regulatory subunits ($\beta$ and $\gamma$);
- Binding of AMP to four nucleotide-binding sites in the $\gamma$ subunit ➔ activation of the catalytic $\alpha $ subunit;
- Activation of AMPK also requires phosphorylation of a specific threonine residue in the $\alpha$ subunit, and AMP binding to the $\gamma$ subunit allosterically protects against dephosphorylation of this residue in the $\alpha$ subunit;
- Two upstream kinases, LKB1 and Ca2+/calmodulin-dependent protein kinase kinase $\beta$ (CaMKK$\beta$), are known to phosphorylate the critical Thr residue.
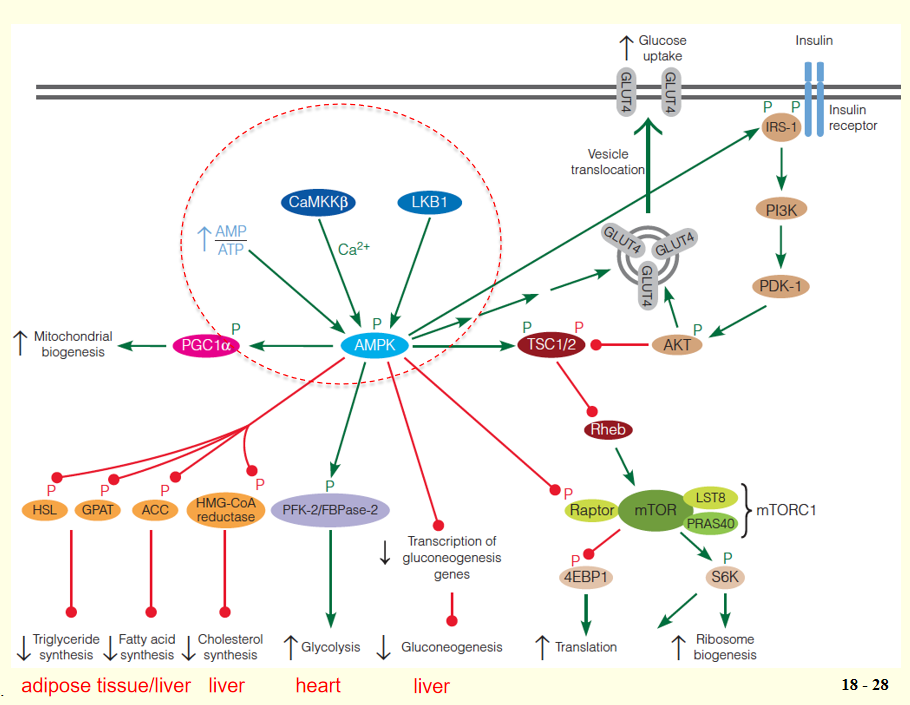
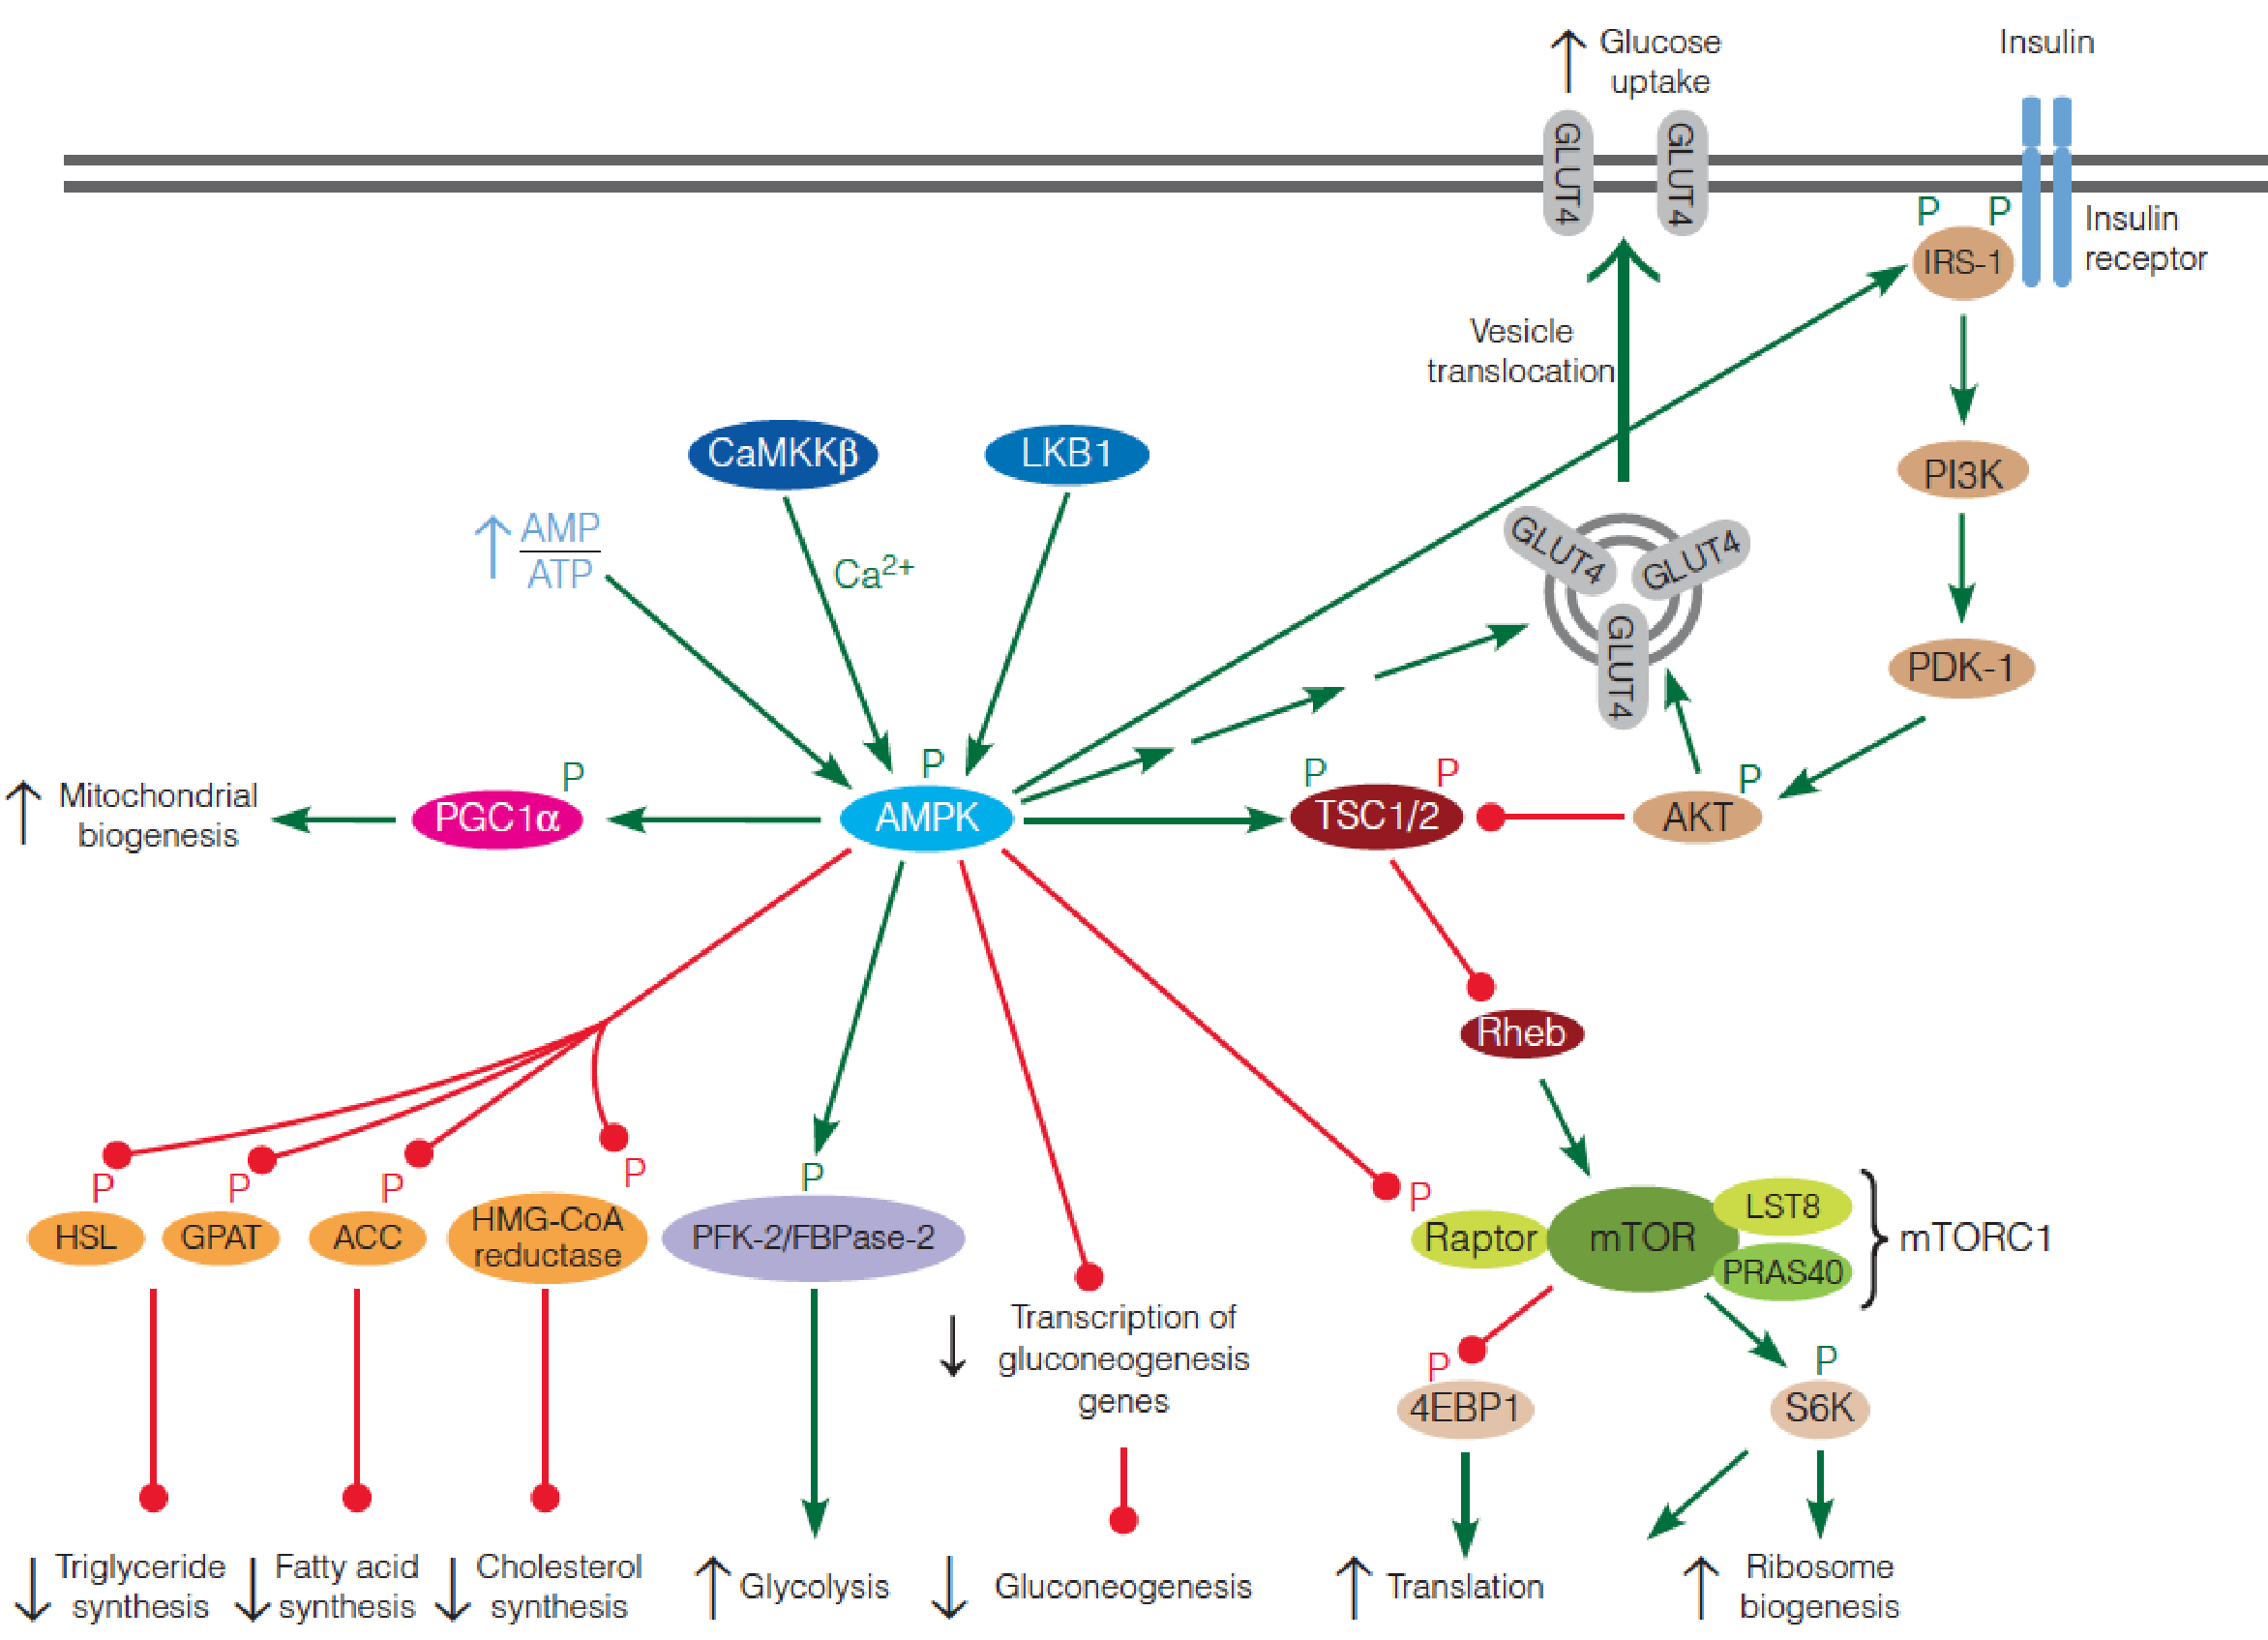
AMPK enhances energy-producing pathways and inhibits energy-requiring pathways
- 4EBP1: eukaryotic initiation 4E-binding protein
- S6K: ribosomal protein S6 kinase
- LKB1: Liver kinase B1
- CaMKKb:Ca2+/calmodulin-dependent protein kinase kinase b
- IRS: insulin receptor substrate
- PGC-1: peroxisome proliferator-activated receptor-gamma coactivator 1
- TSC: tuberous sclerosis complex
- PI3K: phosphoinositide 3-kinase
AMPK phosphorylates multiple substrates that enhance energy-producing pathways, including targets that stimulate glucose uptake (via retranslocation of GLUT4 to the plasma membrane), glycolysis in heart (via stimulation of the kinase activity of the heart-specific PFK-2/FBPase-2), and mitochondrial biogenesis;
At the same time, other AMPK targets inhibit energy-requiring pathways, including hepatic gluconeogenesis (via decreased transcription of gluconeogenic enzymes), fatty acid synthesis (via acetyl-CoA carboxylase), TG synthesis (via glycerophosphate acyltransferase and hormone-sensitive lipase), cholesterol synthesis (via HMG-CoA reductase).
2. Mammalian Target of Rapamycin(mTOR)
mTOR is the other main player in the regulation of energy homeostasis.
- Like AMPK, highly conserved serine/threonine protein kinase found in all eukaryotes.
- In contrast to AMPK, mTOR is active under nutrient-rich conditions and inactive under nutrient-poor conditions;
Activated mTOR promotes anabolic processes, including cell proliferation, protein synthesis, and biosynthesis, but inhibits catabolic processes;
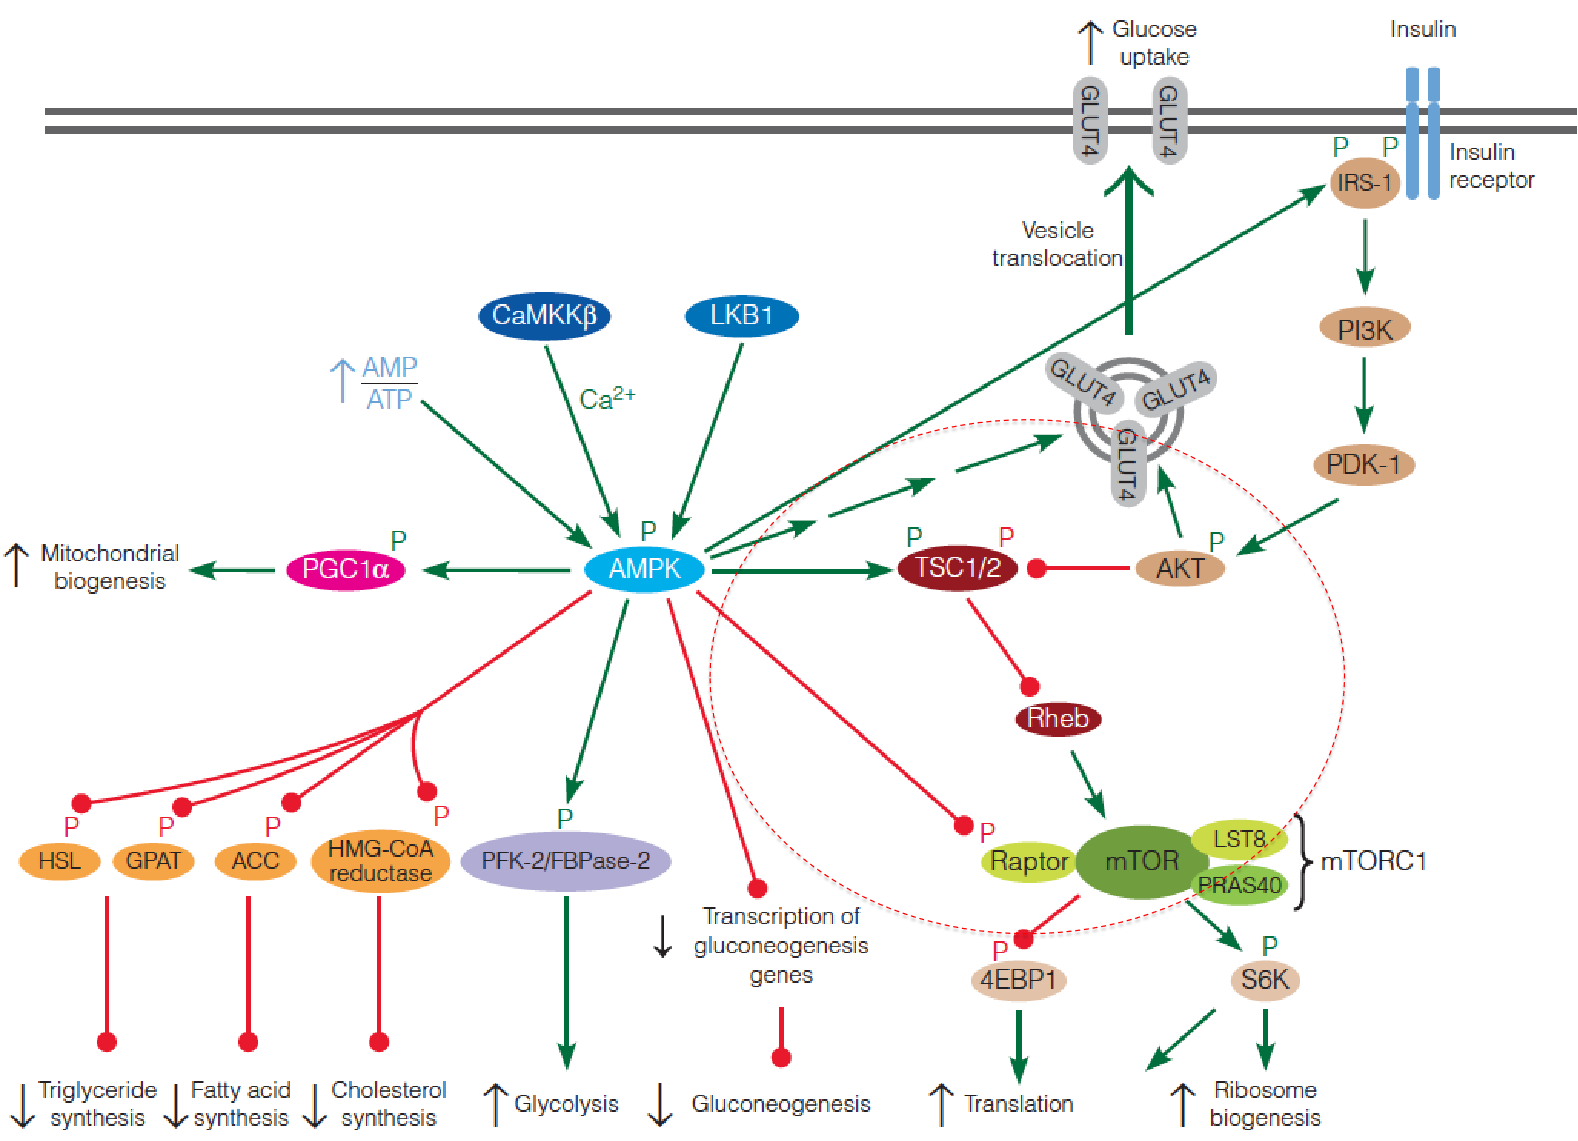
mTOR exists as two distinct multiprotein complexes: a rapamycin-sensitive complex (mTORC1: mTOR, mLST8, raptor and PRAS40) and a rapamycin-insensitive complex (mTORC2: mTOR, mLST8, rictor, Sin1 and PRR5/Protor);
mTOR was discovered during biochemical studies with the bacterial macrolide, rapamycin (雷帕霉素), a potent immunosuppressant(免疫抑制剂). Rapamycin binds to a small cellular protein, FKBP12, and this FKBP12-rapamycin complex allosterically inhibits mTORC1, but has no effect on mTORC2.
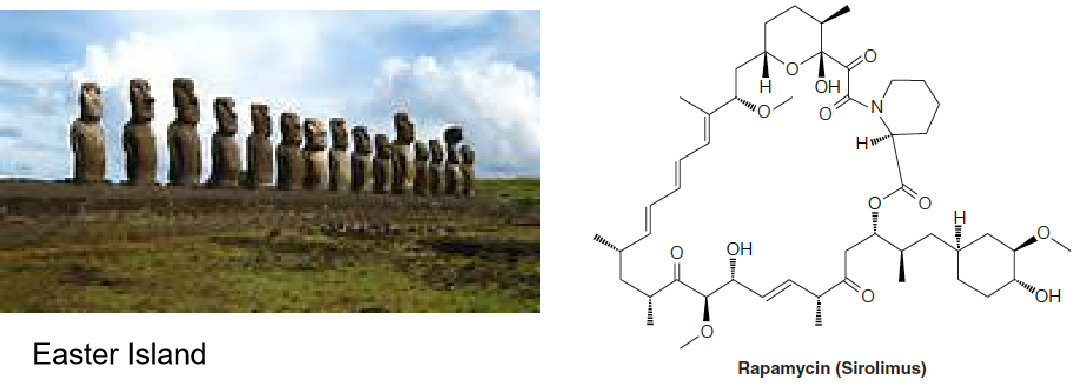
- Rapamycin extends life span of old mice;
- Immnuosuppressant drug
mTOR downstream substrates: 4EBP1 and S6K
The two best-characterized substrates of mTORC1 are 4EBP1 (eukaryotic initiation 4E-binding protein) and S6K (ribosomal protein S6 kinase);
4EBP1 normally inhibits the translation initiation factor eIF4E; phosphorylation of 4EBP1 by mTORC1 suppresses its ability to bind eIF4E and inhibit translation;
- Double negative regulation = Positive regulation
Phosphorylation of S6K by mTOR activates this downstream protein kinase, which phosphorylates a number of proteins involved in translational control;
The net effect of phosphorylation of 4EBP1 and S6K by mTORC1 is thus stimulation of protein synthesis and ribosome biogenesis.
Upstream Regulators of mTOR: TSC1/2
mTOR activity is regulated by a number of upstream inputs, most of which are transmitted through the tuberous sclerosis complex (TSC);
This complex, first discovered as a tumor suppressor, is composed of TSC1 (hamartin) and TSC2 (tuberin);
TSC2 contains a GTPase activating protein (GAP) domain ➔ that inactivates the small Ras-like GTPase Rheb;
- Rheb ↓ ➔ normally activates mTOR ↑ , thus loss of TSC1 or TSC2 leads to hyperactivation of mTORC1;
TSC serves as an integration point for regulation of mTORC1, receiving inputs from a wide variety of environmental signals, including growth factors (e.g., insulin and epidermal growth factor), energy status, and nutrient availability;
Insulin signaling regulation of mTOR activity
Insulin signaling begins with phosphorylation of an insulin receptor substrate (IRS) protein by the tyrosine kinase activity of the plasma membrane insulin receptor;
Phosphorylated IRS activates phosphoinositide 3-kinase (PI3K), which converts membrane phosphatidylinositol 4,5-bisphosphate (PIP2) to phosphatidylinositol 3,4,5-triphosphate (PIP
3), a second messenger with a variety of intracellular targets.PIP3 activates yet another protein kinase (PKD1), which then activates a third protein kinase Akt;
Akt (also called PKB) then phosphorylates TSC, inactivating the complex, resulting in activation of mTORC1;
Activated Akt also stimulates GLUT4 translocation to the plasma membrane, accounting for insulin-stimulated glucose transport in muscle cells.
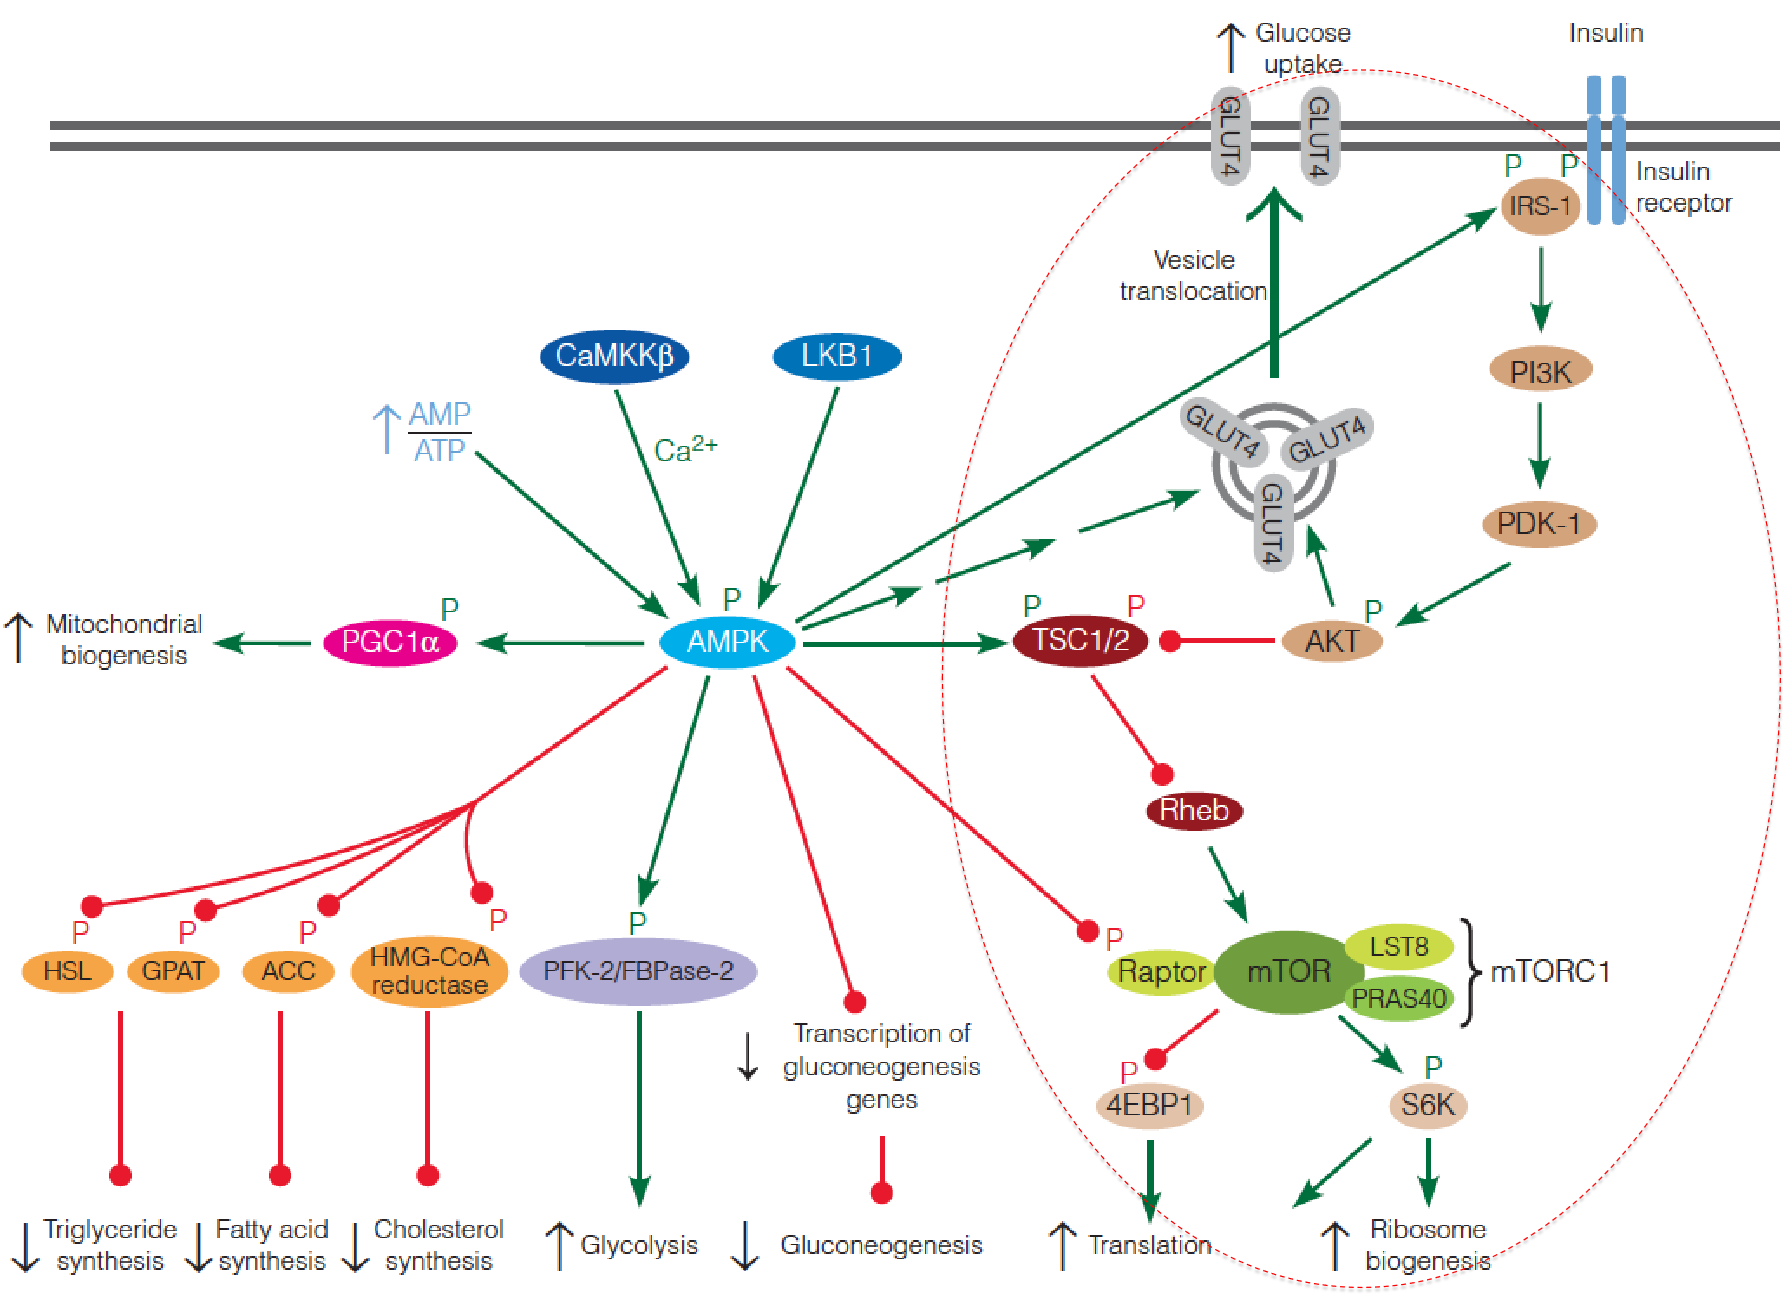
3. AMPK suppresses mTOR
Activated AMPK phosphorylates the TSC complex, which suppresses mTORC1 by inhibiting Rheb;
Activated AMPK also directly inhibits mTORC1 by phosphorylation of the raptor subunit of the complex;
AMPK also modulates the insulin signaling pathway by phosphorylating IRS, thereby increasing the sensitivity of the cell to insulin.
In summary, AMPK and mTOR play opposing roles in controlling metabolic activity of cells in response to intracellular and extracellular signals.
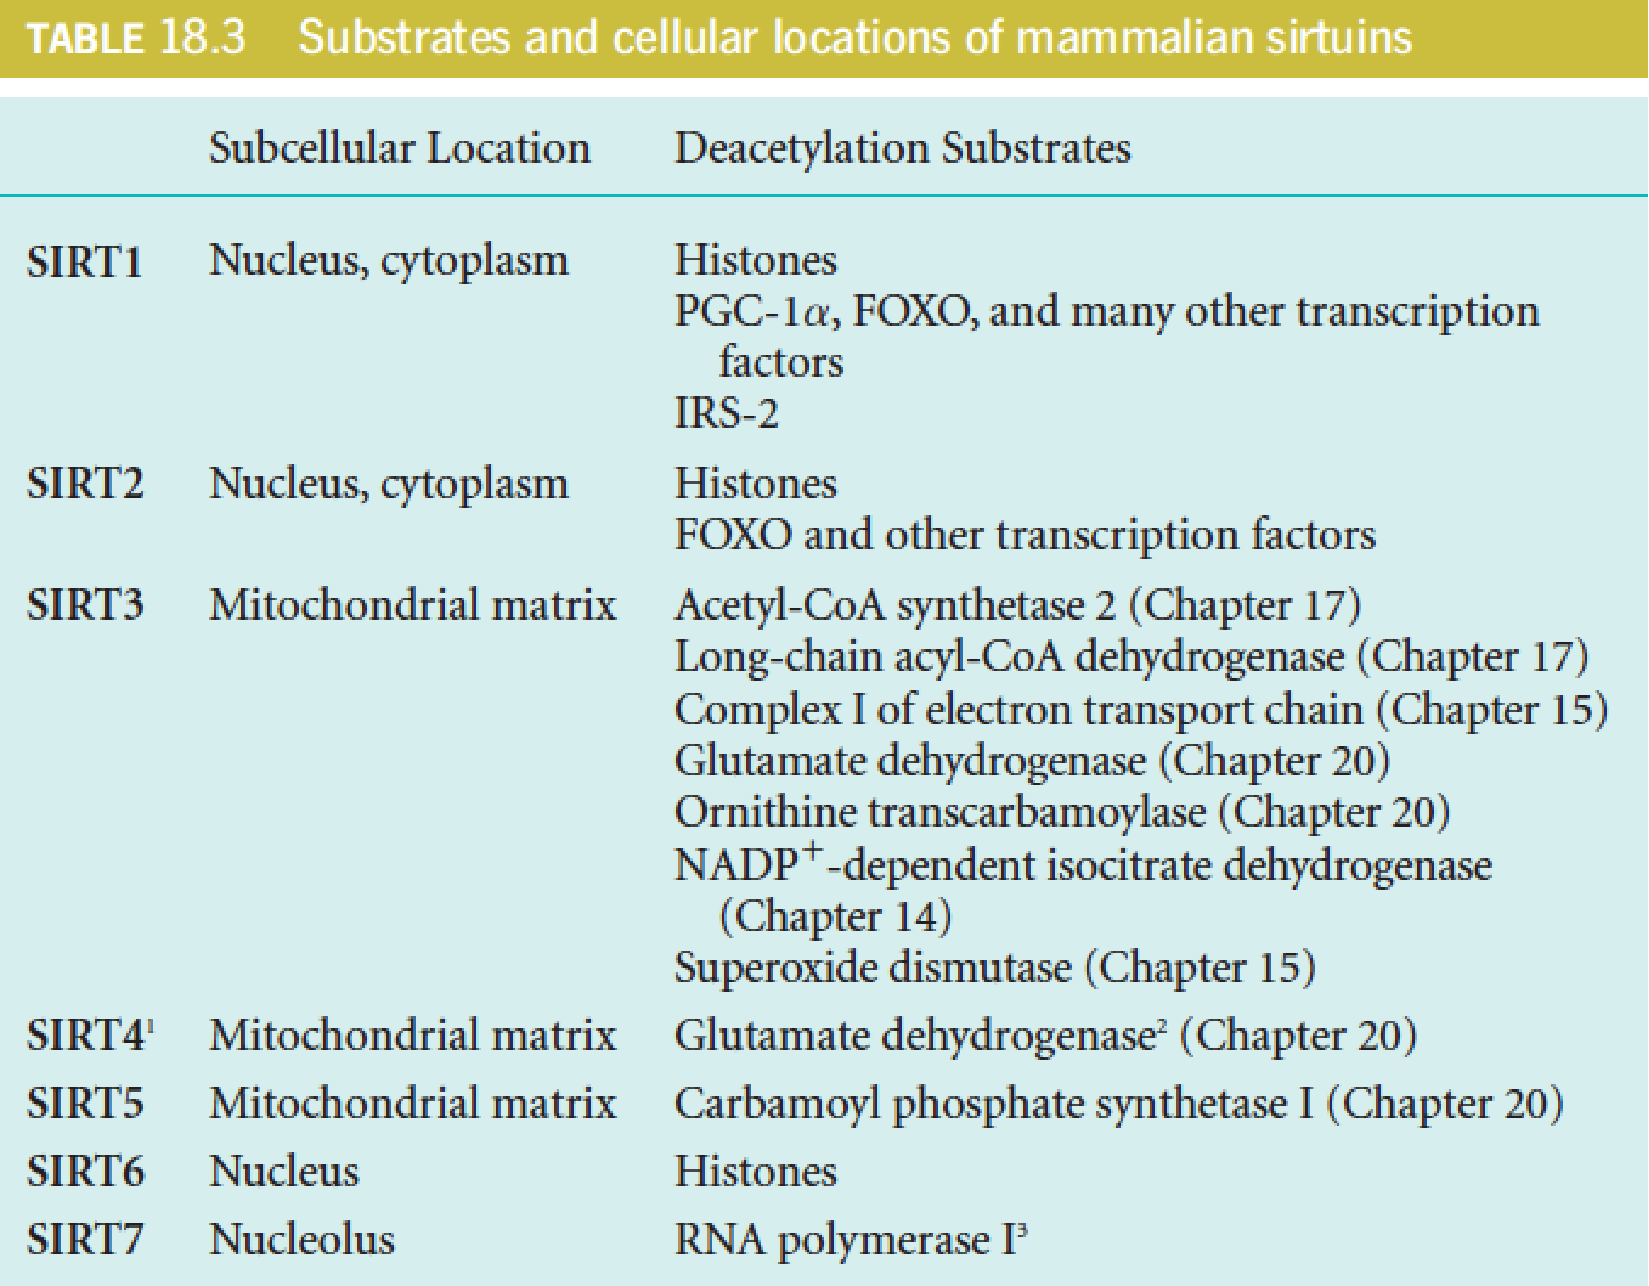
4. Sirtuins
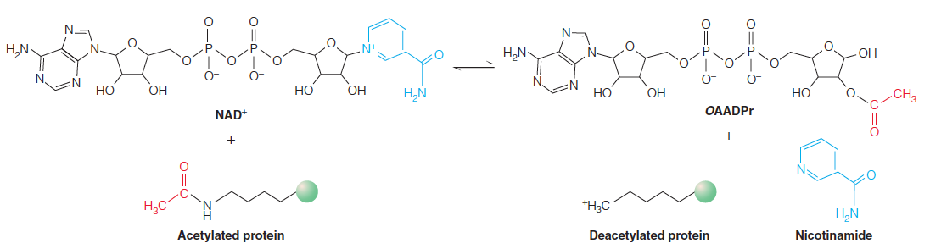
Sirtuins (沉默调节蛋白) are a highly conserved family of NAD+-dependent protein deacetylases. (去乙酰化酶)
Sirtuins are named after the founding member of the family, yeast Sir2 (silent information regulator 2), which deacetylates histones to regulate gene expression (silencing) of the mating type locus in yeast.
Sirtuins are now known to act on many proteins besides histones, and they are structurally conserved from bacteria to humans.
Mammals possess seven sirtuins (SIRT1-7), which differ in their cellular localization (nucleus, mitochondria, cytoplasm) and protein targets.
For most protein targets, deacetylation increases the activity of the target protein.
The deacetylase activity of sirtuins is sensitive to changes in the cellular NAD+ levels, being enhanced at high NAD+/NADH ratio.
Thus, sirtuins act as metabolic sensors of the cellular redox state.
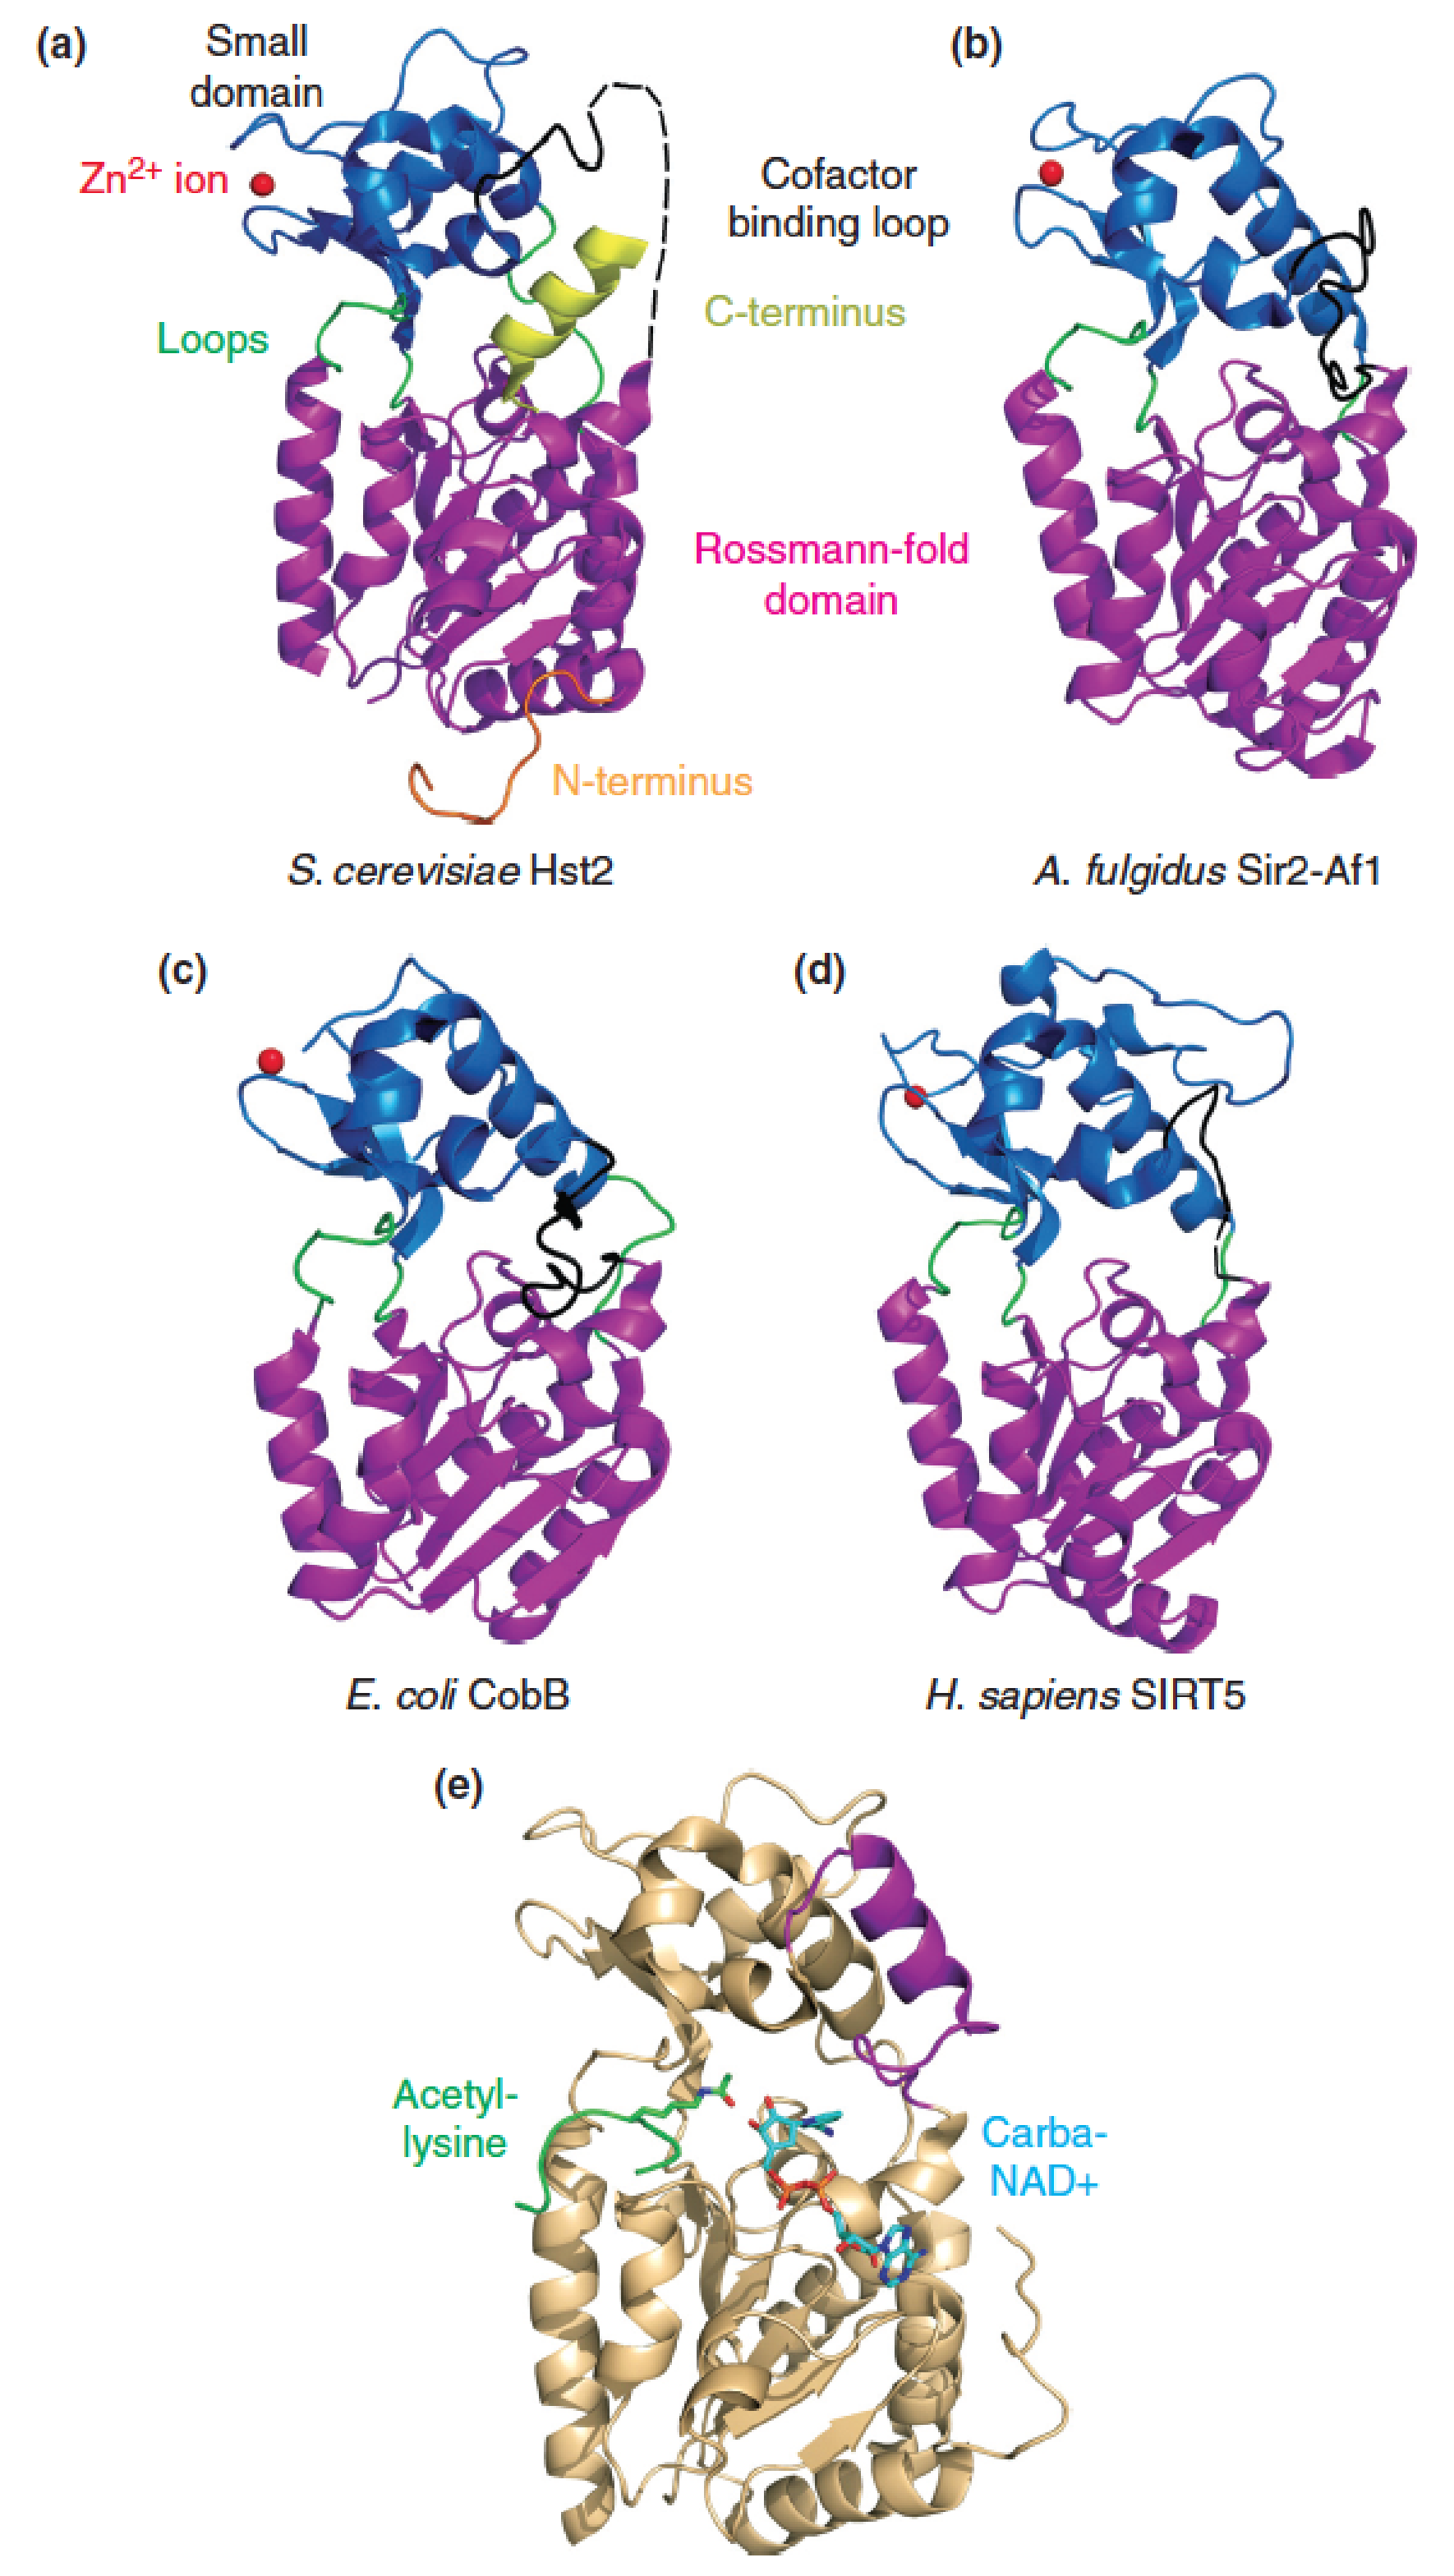
Catalytic core of sirtuins is evolutionarily conserved:
X-ray crystal structures of the catalytic cores of sirtuins from:
- Yeast
- Archaea 古菌域
- eubacterium 真杆菌
- Human
- yeast Hst2 sirtuin with bound acetylated peptide substrate and carba-NAD+, a substrate analog
Show a high degree of structural similarity.
PGC-1 and SIRT1 control the reprogramming of fuel utilization pathways in response to fasting
A high NAD+/NADH ratio, in response to low nutrients (fasting), activates SIRT1 to deacetylate PGC-1, upregulating its transcriptional coactivator function.
- Tissue-specific transcriptional activation programs result in increased gluconeogenesis (liver) and increased fatty acid oxidation (skeletal and heart muscle).
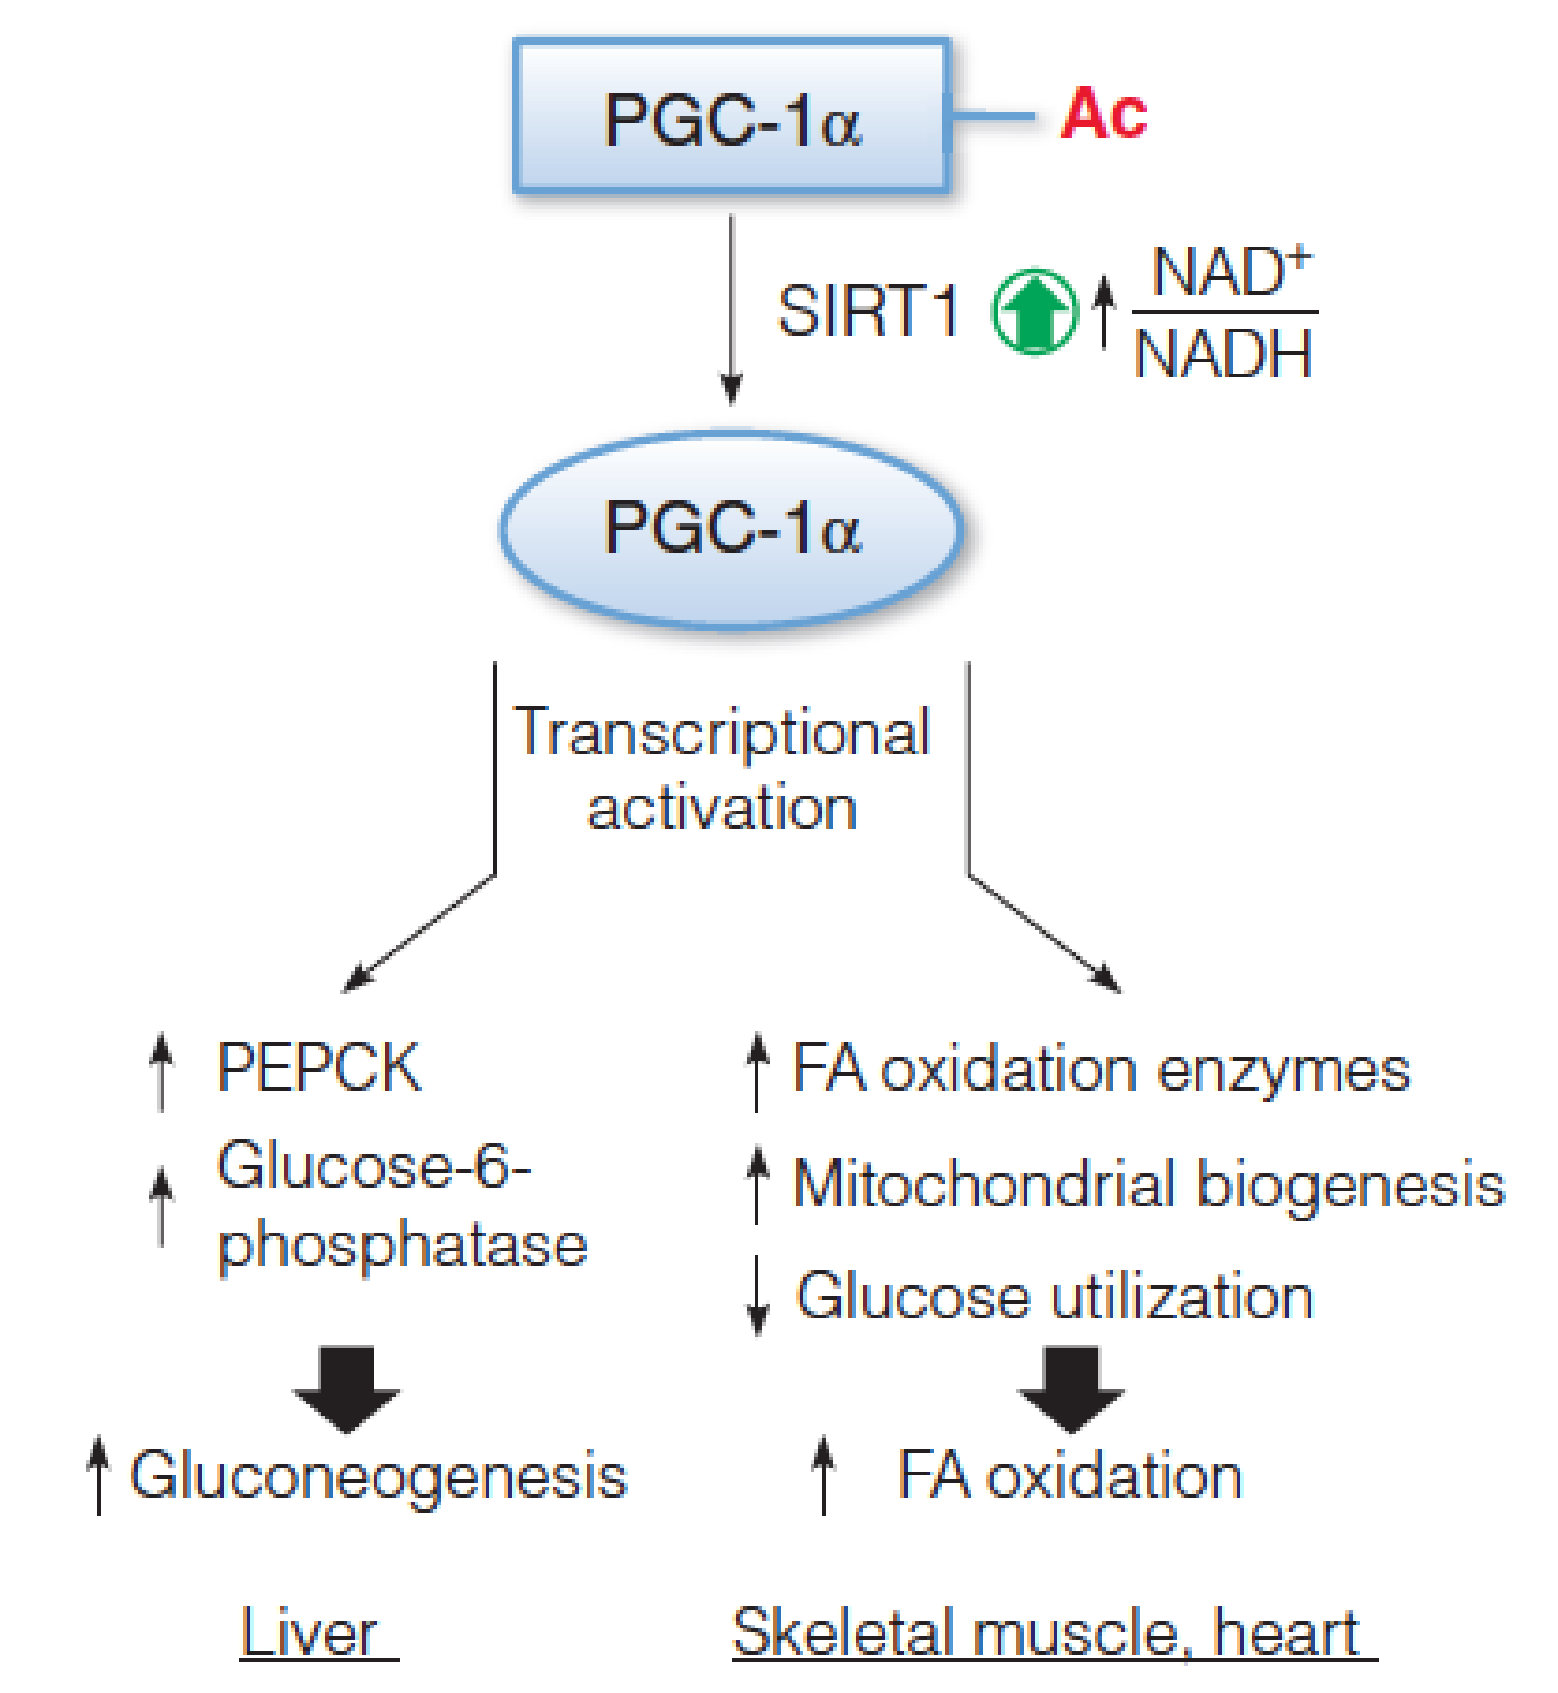
- PGC-1: peroxisome proliferator-activated receptor-gamma coactivator 1
Calorie restriction (CR) extends lifespan in organisms ranging from yeast to primates.
The mechanisms are not fully understood, but sirtuins are important mediators of this response.
Although resveratrol (白藜芦醇) and newer classes of SIRT1 activators do indeed confer many phenotypes of CR on fed animals, they are not likely to represent a simple “fountain of youth.”
Nonetheless, pharmacological manipulation of sirtuin function holds great promise for treatment of aging-related diseases.
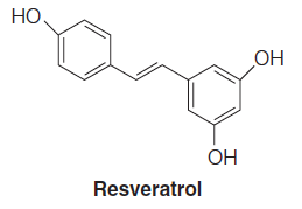
- Resveratrol: found in red grapes (and thus red wine), berries
- CR delays the onset of aging-associated diseases (diabetes, cancer, cardiovascular diseases, and brain atrophy)
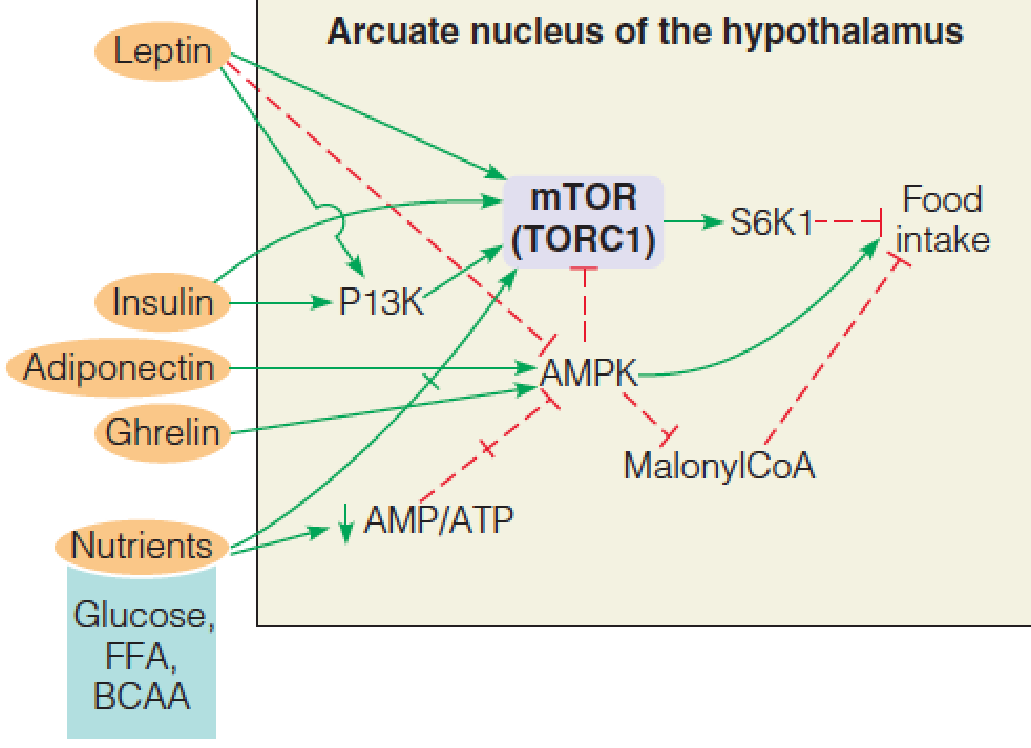
5. Fuel and hormonal control of food intake in the arcuate nucleus (弓状核) of the hypothalamus (下丘脑)
Activation of AMPK promotes food intake;
- inhibition of AMPK suppresses food intake.
Insulin acts through the phosphoinositide 3-kinase (PI3K) cascade to inhibit food intake.
Leptin (瘦素) has both direct and indirect effects (through PI3K and AMPK) on mTOR.
Adiponectin (脂联素) and ghrelin stimulate food intake by activating AMPK.
- In mammals, the brain coordinates whole body energy homeostasis. The brain receives information about the quality and quantity of nutrients being consumed, the levels of fuels already present in the blood, and the amounts of energy present in various storage depots in the body.
- The most important endocrine regulators of food intake are insulin and leptin (inhibit intake), and ghrelin and adiponectin (promote intake). Each of these act via specific receptors on particular cells in the arcuate nucleus to initiate signaling pathways that converge on AMPK and mTOR.
三、Responses to Metabolic Stress: Starvation, Diabetes
Major events in the storage, retrieval, and use of fuels in the fed and unfed states and in early starvation:
An excellent way to understand how the interorgan and hormonal relationships actually integrate fuel metabolism is to examine the effects of metabolic stress:
- Prolonged fasting, in which the intake of fuel substrates is inadequate;
- Diabetes mellitus, in which a functional insufficiency of insulin impairs the ability of the body to use glucose, even when the sugar is present in abundance.
Glucose levels are maintained during normal feeding cycles
Shortly after a carbohydrate-containing meal, blood glucose elevation occurs. Stimulates insulin secretion; Suppresses glucagon secretion
Insulin promotes uptake of glucose into the liver, stimulates glycogen synthesis, suppress glycogen breakdown;
Flux through hexokinase IV increases in response to elevated glucose levels, providing substrates for glycogen synthesis;
Activation of acetyl-CoA carboxylase (ACC) in the liver stimulates fatty acid synthesis with subsequent transport to adipose tissue as TAG in VLDL;
The increased levels of glycogenic intermediates and fatty acids stimulate TAG synthesis;
Increased glucose uptake into muscle increases levels of substrates for glycogen synthesis.
Several hours later, when blood glucose levels begin to fall, the above events are reversed;
Insulin secretion slows and glucagon secretion increases;
This promotes glycogen mobilization in liver via the cAMP-dependent cascade; mechanisms that activate glycogen phosphorylase and inactivate glycogen synthase;
TAG breakdown in adipocytes is activated as well, via the action of hormone-sensitive lipase, generating fatty acids for use as fuel by liver and muscle;
At the same time, the decrease in insulin levels reduces glucose use by muscle, liver, and adipose tissue;
Consequently, nearly all the glucose produced in the liver is expected to the blood and is available for use by the brain
- Metabolic adaptations promote alternative fuel use during starvation so that glucose homeostasis is maintained for several weeks.
Starvation
1. Using Carbohydrates and TAG
- Glycogen, 6700 kJ, this source of blood glucose will be exhausted in just a few hours;
It is critical for brain function that blood glucose levels be maintained near 4.4 mM, the organism adapts metabolically to increase the use of fuels other than carbohydrate, primarily fat;
565,000 kJ TG, largely in adipose tissue; 100,000 kJ mobilizable proteins, largely in muscle, enough to permit survival for up to several months. However, use of these stores presents problems:
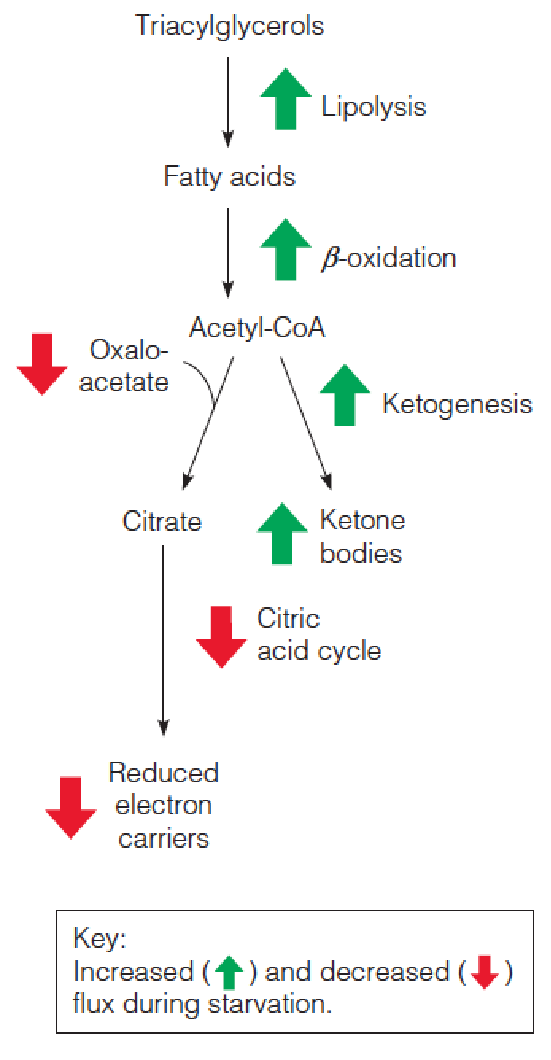
- TAG mobilization generates metabolic fuel largely in the form of acetyl-CoA, whose further oxidation in the citric acid cycle requires oxaloacetate, which must be replenished (补充) via anaplerotic (回补) pathways.
The most important of these processes is the pyruvate carboxylase reaction, with most of the pyruvate coming from carbohydrate catabolism. When carbohydrate availability is limited, the resupply of citric acid cycle intermediates is limited, and flux through the cycle may be reduced.
During carbohydrate limitation, citric acid cycle intermediates can be provided from other sources:
- The glycerol released from lipolysis, but not produced enough amounts to maintain levels of citric acid cycle intermediates
2. Using Proteins
Intermediates from protein catabolism and transamination, but this process is energetically wasteful and has the undesirable effect of wasting the muscle and weakening the fasting subject.
- Proteolysis is accelerated during the first few days of starvation. A major fate of the released amino acids is gluconeogenesis.
During this time, the liver and muscle are shifting to fatty acids as the dominant fuels for their own use.
Meanwhile, the increased use of carbon for gluconeogenesis diminishes the amount of oxaloacetate available to combine with acetyl-CoA in the citric acid cycle.
3. Use Ketonebodies
Fat breakdown↑ ➔ acetyl-CoA and reduced electron carriers accumulate ↑ in the liver ➔ cannot be oxidized ➔ ketone bodies accumulation ↑.
Thus, brain adapts to reduce glucose levels by increasing the use of ketone bodies as alternative energy substrates. This trend continues for the duration of starvation.
On the 3rd day, 1/3 energy from ketone bodies; By day 40, 2/3 energy from ketone bodies.
- This adaptation reduces the need for gluconeogenesis and spares the mobilization of muscle proteins. About 75 grams proteins consumed per day on day 3; About 20 gram proteins consumed per day on day 40.
The metabolic changes accompanying starvation compromise the organism’s abilities to responds to further stress, such as extreme cold or infection.
However, the adaptations do allow life to continue for many weeks without food intake, the total period being determined largely by the size of the fat deposits.
Diabetes
Diabetes results either from insulin deficiency or from defects in the insulin response mechanism.
- Diabetes is a major public health issue worldwide
- It is estimated that more than 12% of the adult population in the United States is afflicted with this disease.
- China: about 21 millions; India: about 32 millions. Type I: 5~10%; Type II: 90-95%.
Diabetes can be thought of as “starvation in the midst of plenty“ because cells are unable to utilize the glucose that accumulates in the blood.
Type 1 diabetes, formerly called insulin-dependent diabetes, or juvenile diabetes because of its typical early onset, often involves autoimmune destruction of the $\beta$ cells of the pancreas, which can be caused by various factors, including viral infections.
Some forms of type 1 diabetes have a genetic origin. Mutations in the insulin structure can render the hormone inactive, and other mutations cause defects in the conversion of preproinsulin or proinsulin to the active hormone. Either way, type 1 diabetes is characterized by insulin deficiency, can be treated by administration of insulin.
Type 2 diabetes, formerly called adult-onset diabetes, obesity-related diabetes, or non-insulin-dependent diabetes mellitus, is characterized by insulin resistance—patients cannot respond to therapeutic doses of insulin. Type 2 diabetes accounts for more than 95% of people with diabetes
1. Obesity and insulin resistance in type 2 diabetes
The specific defects that led to insulin resistance in type 2 diabetes are not known, but several clues are beginning to shed some light on the disease;
- Most people with type 2 diabetes are also obese, in fact, obesity is so closely associated with insulin resistance that there must be a mechanistic link;
- Like diabetes, the prevalence of obesity has dramatically increased in the United States since 1970s, with 34% of adults classified as obese in 2010;
The close relationship between type 2 diabetes and metabolic syndrome.
- Metabolic syndrome, which afflicts with 50 million Americans, is defined by abnormal obesity, hypertension, high blood sugar, and, more importantly, insulin resistance. These metabolic abnormalities often precede both cardiovascular disease and diabetes;
Common to both obesity and metabolic syndrome is excess fuel intake and abnormal accumulation of lipid in “ectopic sites”, primarily liver and skeletal muscle.
Abnormal lipid accumulation cause insulin resistance in type 2 diabetes
The lipid overload hypothesis state that fat accumulation in muscle cells, blocks the insulin signaling pathway that normally stimulates translocation of GLUT4 ( the major glucose transporter in muscle) to the membrane. Thus, insulin no longer efficiently stimulates glucose transport, that is , the cell is insulin resistant.
The Inflammation hypothesis states that as adipose cell increase in size with excess lipids, they secrete inflammatory adipokines, including TNF-α, interleukins, and resistin. These cytokines bind to their receptors in peripheral tissues such as muscle and stimulate an inhibitory phosphorylation of IRS, making it a poor substrate for the insulin receptor tyrosine kinase. Once again, insulin signaling is shut down, and the cell becomes insulin resistant.
Thus, although type 2 diabetes has long been characterized by defects in carbohydrate metabolism, abnormal lipid metabolism may be the root of the disease.
insulin resistance in Type 2 diabetes
2. The metabolic abnormalities in diabetes
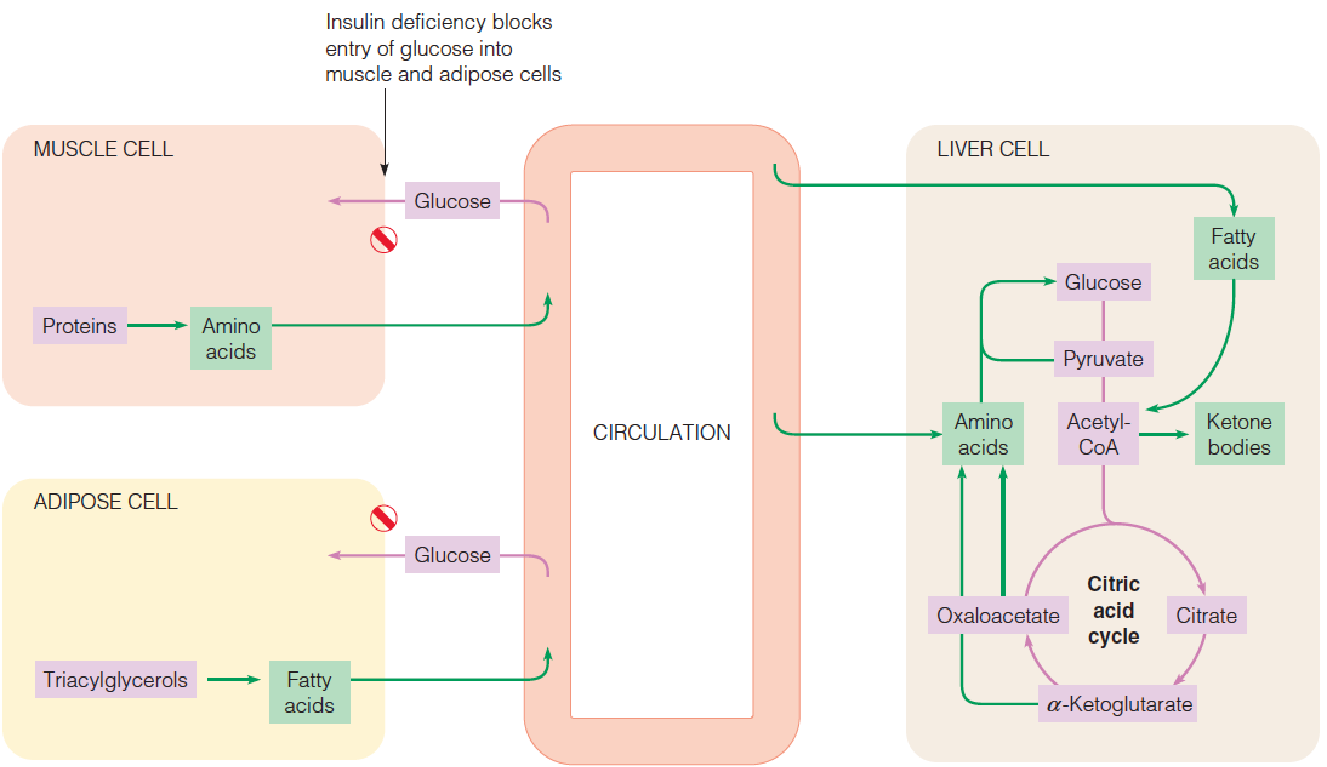
The insulin deficiency blocks the uptake of glucose into muscle and adipose tissue and reduces glucose catabolism in all tissues.
- Proteolysis in muscle and lipolysis in adipose tissue are enhanced.
- In the liver, gluconeogenesis from amino acids and citric acid cycle intermediates is stimulated as the cells attempt to remedy the perceived lack of usable glucose, and fatty acid oxidation and ketogenesis are also increased.
The insufficient production of insulin or the failure of insulin to act normally in promoting glucose utilization lead to:
- glucose accumulation in the blood;
- starves the cells of nutrients;
- promotes metabolic responses similar to those of fasting;
Liver cells attempt to generate more glucose by stimulating gluconeogenesis. Most of the substrates come from amino acids, which in turn come largely from degradation of muscle proteins;
- Glucose cannot be reused for resynthesis of amino acids or of fatty acids, so a person with diabetes may lose weight even while consuming with would normally be adequate calories in the diet.
As cells attempt to generate usable energy sources, TG depots are mobilized in response to the abnormally low insulin-to-glucagon ratio;
- Fatty acid oxidation is elevated, with concomitant generation of acetyl-CoA;
Flux through the citric acid cycle may decrease because of the accumulation of reduced electron carriers and/or oxaloacetate limitation;
In liver, both effects accelerate ketone bodies formation, generating increased levels of organic acids in the blood (ketosis). These acids can lower the blood pH from the normal value of 7.4 to 6.8 or lower (ketoacidosis);
Decarboxylation of acetoacetate, which is stimulated at low pH, generate acetone, which can be smelled on the breath of patients with ketoacidosis;
A special danger is that such people may lose consciousness, and this, coupled with a sweet organic odor in the breath, may give the impression that they are intoxicated, when in fact their lives are in jeopardy.
The excessive concentrations of glucose in body fluids generate other metabolic problems, quite different from anything seen in starvation.
- At the blood glucose levels above 10 mM, the kidney can no longer reabsorb all of the glucose out of the blood filtrate, and glucose is spilled in to the urine, sometimes in amounts approaching 100 grams per day. In fact, the Latin name diabetes mellitus literally means “honey-sweet urine.” Glucose excretion creates an osmotic load, which causes large amounts of water to be excreted as well, and under these conditions the kidney cannot absorb most of this water. In fact, the earliest indications of diabetes are often frequent and excessive urination, coupled with excessive thirst. Long before biochemistry was a science, the loss of nutrients, excessive urination, and breakdown of fat and protein were recognized as hallmarks of diabetes.
In type 1diabetes, the metabolic imbalance is usually more severe and difficult to control than in the milder and more common type 2 diabetes. The latter can often be controlled by exercise and dietary restriction of carbohydrate, whereas the treatment of type 1 diabetes involves daily self-injection of insulin. For many years this insulin was purified from bovine pancreas, and its high cost, coupled with occasional problems resulting from the minor structural differences between human and bovine insulin. In the late 1970s, the gene for human insulin was cloned into E.coli in a form that allowed it to be expressed.
Diabetes vs. starvation
In starvation, glucose utilization is abnormally low because of inadequate glucose supplies.
In diabetes mellitus, glucose utilization is similarly low, but the reason in this case is that the hormonal stimulus to glucose utilization-namely, insulin—is defective. As a result, glucose is actually present in excessive amounts.