L2 Visualizing Cells
一、Microscopy
Light microscopy: based on visible light rays and glass optics, most common are “transparency” microscopes where light goes through object (stained with specific dyes or not stained); there are also “reflection” (dissection scopes) and fluorescent microscopes
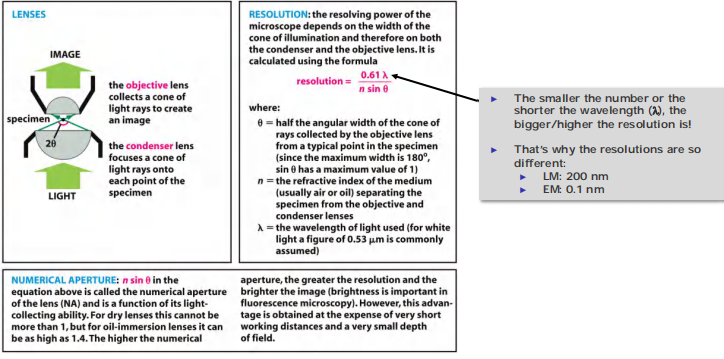
- The numerical aperture affects the light-gathering ability of the lens and is related both to the angle of the cone of light that can enter it and to the refractive index of the medium the lens is operating in;
- The refractive index is the ratio of the speed of light in a vacuum to the speed of light in a particular transparent medium
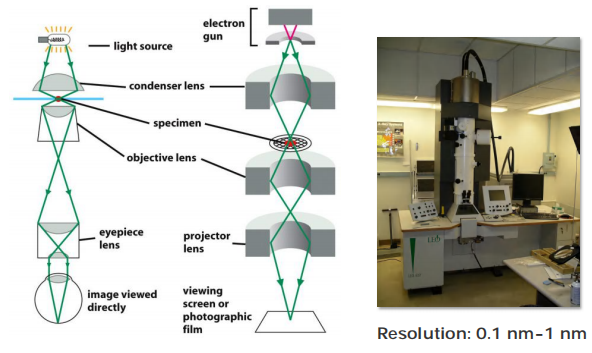
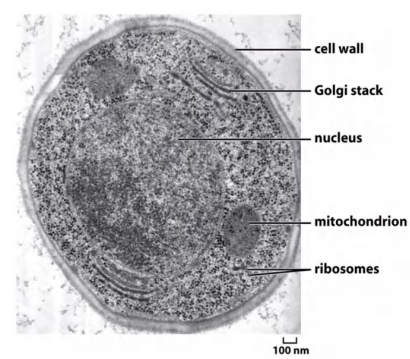
**Transmission electron microscopy (TEM): **based of the flow of electrons through specially prepared (usually stained with osmium, Os, 锇), extremely thin object; allows to see the internal organization of cells and organelles
**Scanning electron microscopy (SEM): ** based on the electronic reflection from the surface covered with metals (typically, gold, Au,金) and provides an image of the surface of cells and organisms
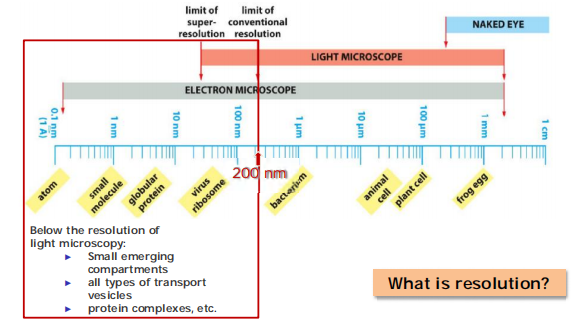
1. Magnification and resolution
Light microscopy vs electron microscopy:
- Resolution of light microscopy: 200 nm
- Resolution of electron microscopy: 0.1 nm
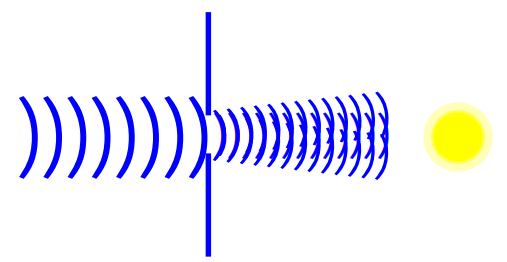
2. The nature of light
Light has a wave nature: light waves
All light waves transit optical systems with slightly different routes, thereby interfering with each other and cause optical diffraction effects
Diffraction
Limits of resolution
Resolution is the minimum distance that two image can be clearly separated.
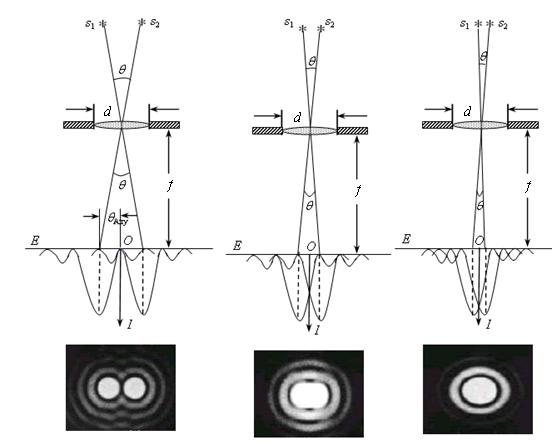
Remember the resolution calculation method and θ,n,λ definiton
Light microscopy / Optical Microscopy
1. Different Examples
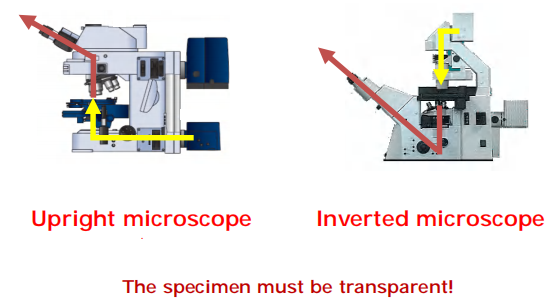
1 | |
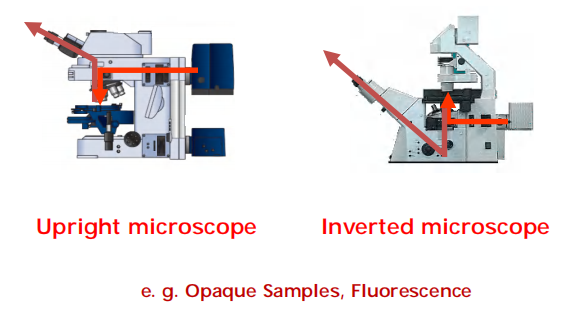
Most microscope has a mixed illumination
2. The principle of light microscopy
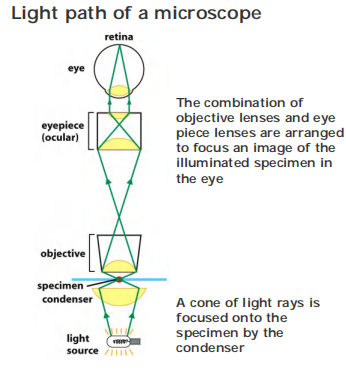
Magnification : up to 1000 fold
Eye piece: up to 10X
Objective: up to 100X
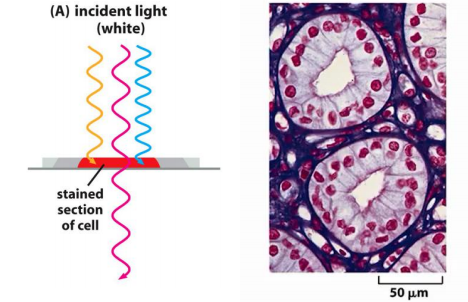
The development of chemical stain
bright-field vs dark-field microscopy
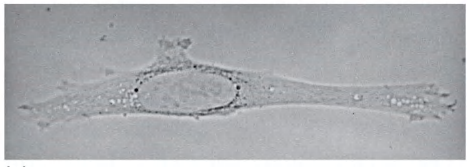
(1) Bright field
Cells appear dark, background appears bright
light passes through a cell to form image directly
(2) Dark field
Cells appear bright, background appears dark
Light illuminates the specimen from the side; only scattered light enters the lenses(光线从侧面照射标本;只有散射的光进入镜头)
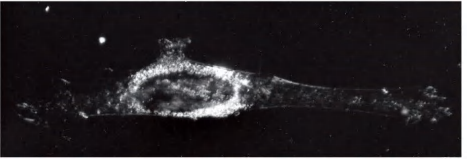
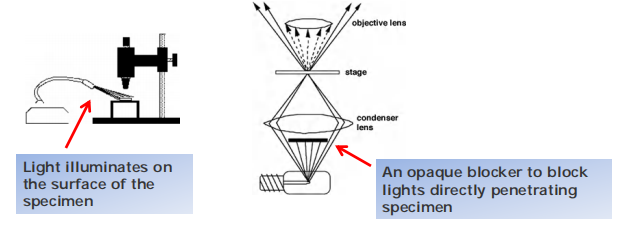
Dark field is especially useful for finding cells in suspension
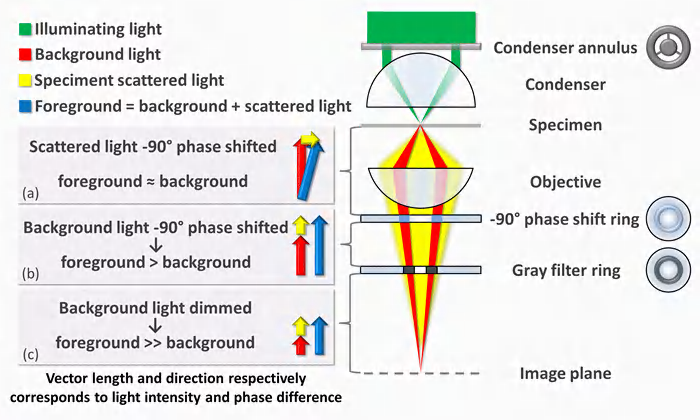
3. Phase Contrast Microscope
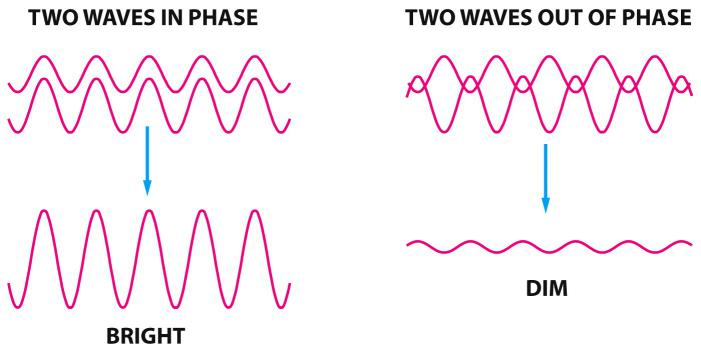
Phase differences results in difference in brightness
When light passes through a living cell, the phase of the light wave is changed according to the cell’s refractive index: a relatively thick or dense part of the cell, such as a nucleus, slows the light passing through it
The phase-contrast microscope and, in a more complex way, the differential-interference-contrast microscope increase these phase differences so that the waves are more nearly out of phase, producing amplitude differences when the sets of waves recombine, thereby creating an image of the cell’s structure.
Problem: live cells are usually colorless and translucent…
Solution : exploitation of interference effects of the light waves
E.g. Phase contrast & Differential-interference –contrast, DIC
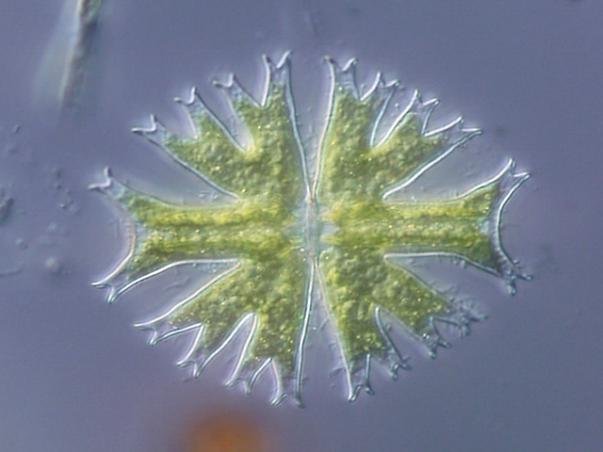
DIC 利用了光的相位差的效应,使得整个图像sharper

细胞表面不同部位的厚度不同,因此显示出的明暗关系不同
Components of a phase contrast microscope
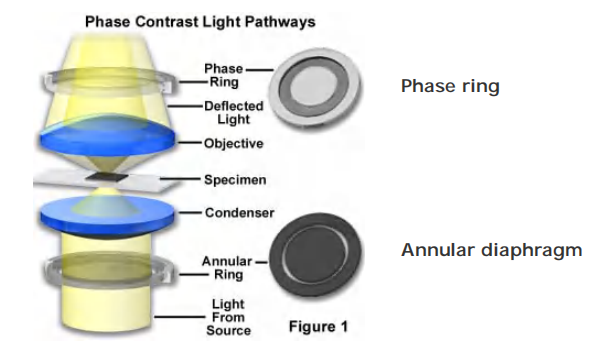
the Principle
利用物体不同结构成分之间的折射率和厚度的差别,把通过物体不同部分的光程差转变为振幅(光强度)的差别,经过带有环状光阑的聚光镜和带有相位片的相差物镜实现观测的显微镜。主要用于观察活细胞或不染色的组织切片,有时也可用于观察缺少反差的染色样品。
4. Differential-Interference Contrast (DIC)
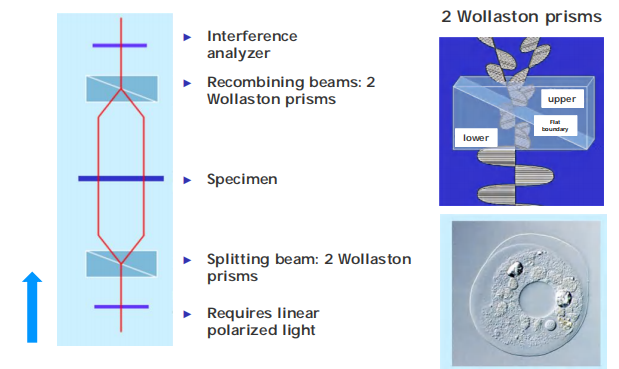
Advantages of DIC – high contrast and plasticity
- Analyze the optical path length gradients (the rate of change for refractive light).
- No annular diaphragm and phase plate needed
- Produce shadow-cast image.
- Elimination of halo artifacts
- Excellent images with relatively thick specimens
Phase-contrast, differential-interference-contrast, and dark-field microscopy make it possible to watch the movements involved in such processes as mitosis and cell migration
5. Fluorescence Microscope
What is fluorescence?
1 | |
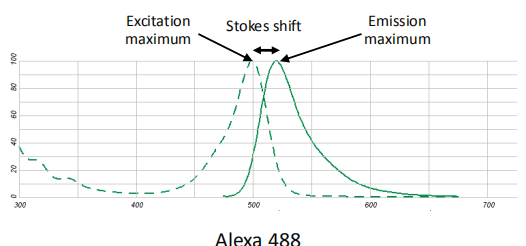
Fluorescence Spectra 荧光光谱
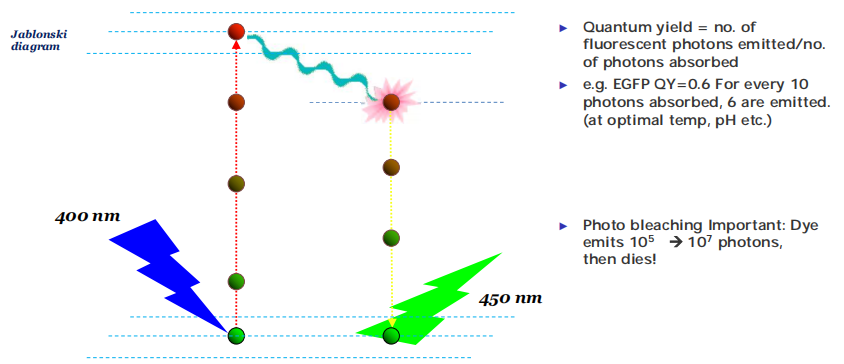
A fluorophore absorbs a photon to be excited
It is not stable and undergoes conformational change to emit a photon
After it emits, it goes back to the ground state.
The cycle can be repeated.
The energy of excitation light is higher than the energy of emission light,因此激发光的波长更短。
Lower energy = longer wavelength
Stokes shift (斯托克斯位移): the difference between excitation energy and the emission energy for a given fluorophore
1 | |
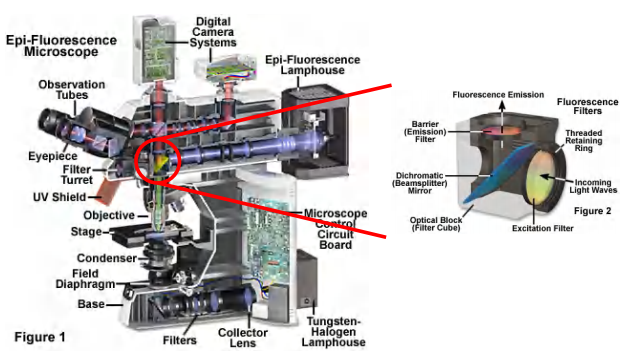
Optical system of a fluorescence microscope
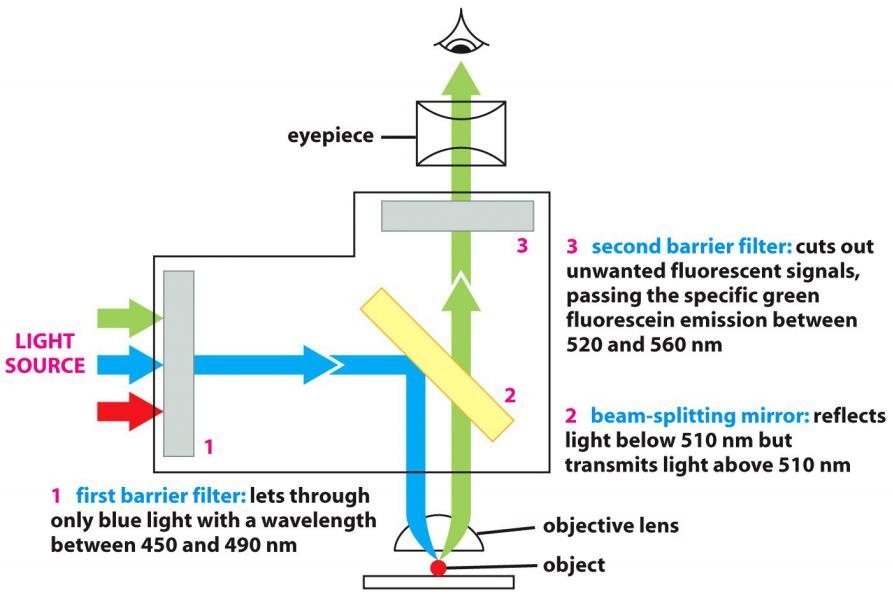
- first barrier filter: lets through only blue light with a wavelength between 450 and 490 nm (选择Excitation Light)
- beam-splitting mirror: reflects light below 510 nm but transmits light above 510 nm(选择特定的光通过,比如反射Excitation,通过Emission)
- second barrier filter: cuts out unwanted fluorescent signals, passing the specific green fluorescein emission between 520 and 560 nm
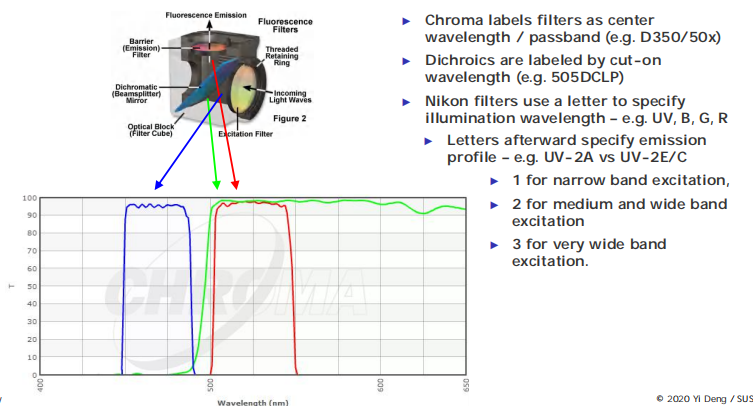
(1) Filter cube and nomenclature
The epifluorescence microscope
(1)Light Sources of epifluorescence microscope (落射荧光显微镜)
Arc Lamps 弧光灯
- Hg and Xe
- Metal Halide(卤化物)
LEDs
Lasers (Sharp wavelength)
- Generally only for collimated illumination (Confocal, TIRF)
Fluorescence probes
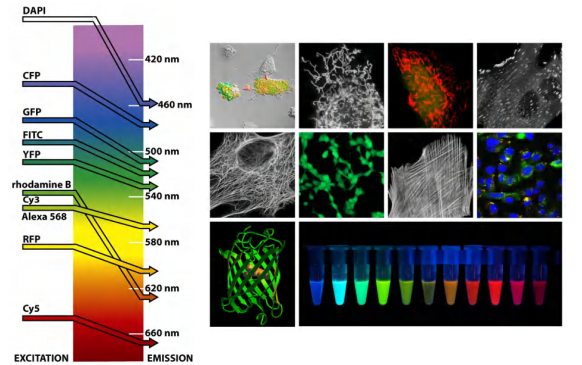
The fluorescent dyes used for staining cells are visualized with a fluorescence microscope
(1) What sort of molecules are fluorescent?
Organic fluorophores
- Intrinsic fluorophores (source of auto fluorescence)
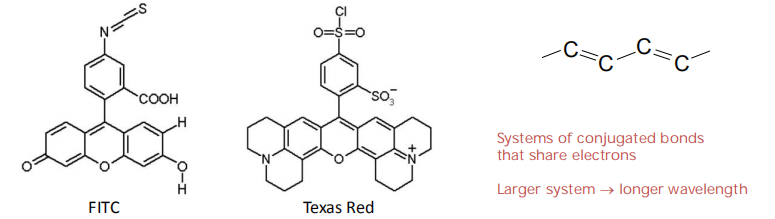
- Dyes: FITC, TRITC, etc..
- Biological fluorophores - Fluorescent proteins: GFP, Phycoerythrin (PE)
- Two fluorescent dyes that have been commonly used for this purpose are fluorescein(荧光素), which emits an intense green fluorescence when excited with blue light, and rhodamine, which emits deep red fluorescence when excited with green–yellow light
Inorganic fluorophores
- Quantum dots
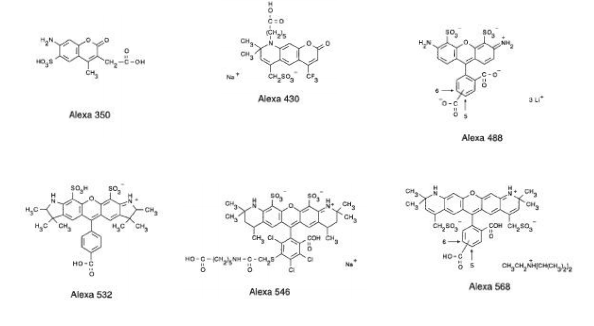
(2) Synthetic fluorescence molecules
Protein labeling: couple to amino- or sulfhydryl groups (used to label the protein cell)
Direct and indirect (immuno-) fluorescence
1 | |
(3) Traditional small fluorescence molecules
(4) DNA probes
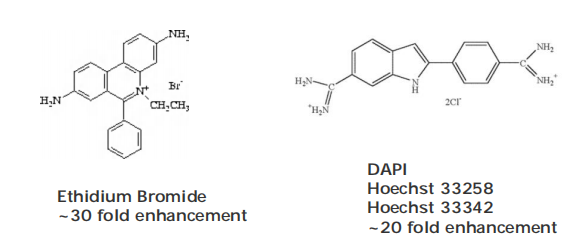
DAPI: different types dye can label dead cells or live cells
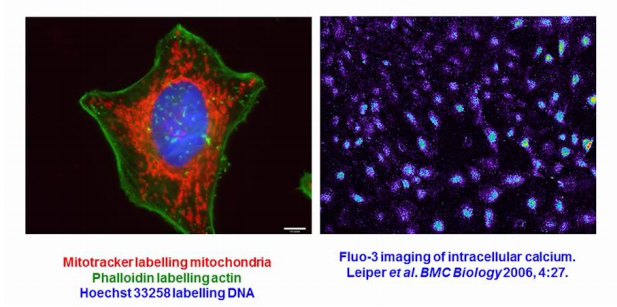
(5) Organelle and chemical specific fluorescently-labelled dyes
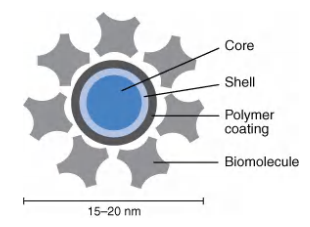
Quantum dots
“Artificial atoms” composed of small semiconductior nanocrystals (“人工原子”由小半导体或纳米晶体组成)
- Tiny crystals of semiconductor material, called nanoparticles, or quantum dots, can be excited to fluoresce by a broad spectrum of blue light. Their emitted light has a color that depends on the exact size of the nanocrystal, between 2 and 10 nm in diameter, and additionally the fluorescence fades only slowly with time
Pros
- (Stable) Little to no photobleaching
- Very bright
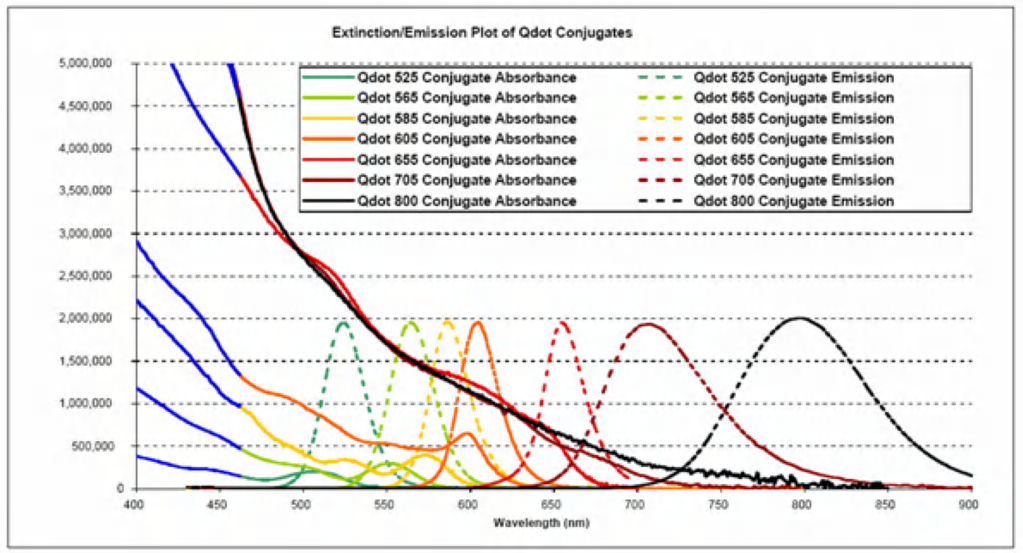
- Narrow emission spectra (can be precisely fine-tuned)
- Can use single excitation wavelength for multiple dyes
Cons
- Large compared to small molecule dyes
- Problems with non-specific binding
Quantum dots Spectrum
Fluorescent labeling
Direct labeling (& microinjection) of target molecules
Direct immunofluorescence: labeled antibodies against target
Indirect immunofluorescence: Unlabeled antibodies against target Labeled antibodies against those antibodies (一抗和二抗)
Parameters of fluorescence molecules
Excitation & emission maxima
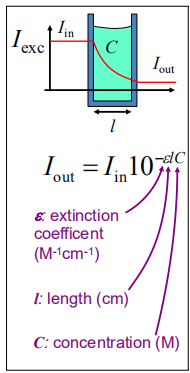
Extinction coefficient ε
- ∝ absorption cross section
- ε ≈ 50,000–100,000 M^-1^cm^-1^
Fluorescence quantum yield $Q_{f}$
- Q
f= # Photons emitted / # photons absorbed - Q
f≈ 25–90% (The higher the better)
- Q
Brightness ∝ ε $Q_{f}$
The enemy of fluorescence molecules: Photobleaching (光漂白;光褪色)
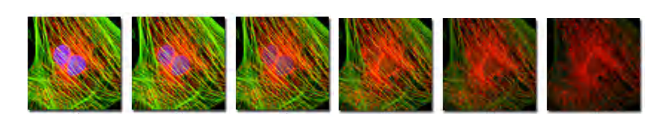
Decrease in emission intensity after exposure
Exciting a molecule once has a probability Qb of killing it
Each molecule will emit only a finite number of photons
Antibody-based immunofluorescence (IF)
IF: specific detection rather than simple neutral observation…
Direct immunofluorescence:
- primary antibody-conjugated fluorescence
Indirect immunofluorescence:
- secondary antibody-conjugated fluorescence
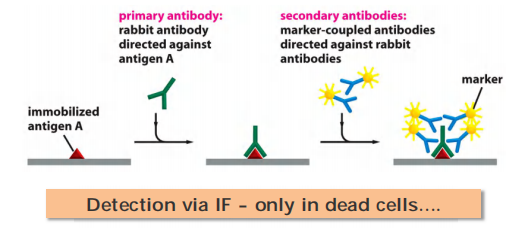
Antibody binding usually not work in living cells.
(1) Immunofluorescence (IF) procedure
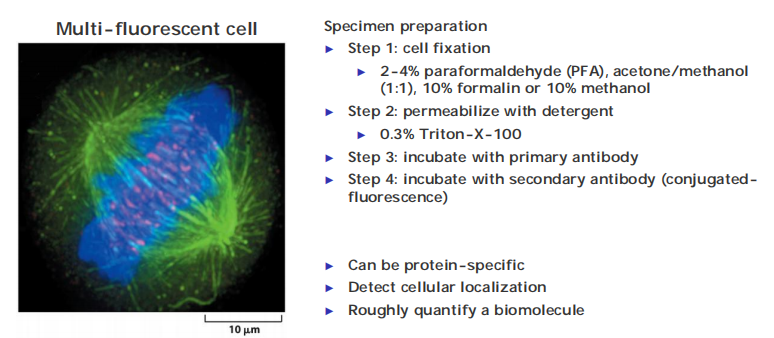
Specimen preparation
Step 1: cell fixation
- 2-4% paraformaldehyde (PFA, acetone/methanol(1:1), 10% formalin or 10% methanol
Step 2: permeabilize with detergent
- 0.3% Triton-X-100
Step 3: incubate with primary antibody
Step 4: incubate with secondary antibody (conjugated-fluorescence)
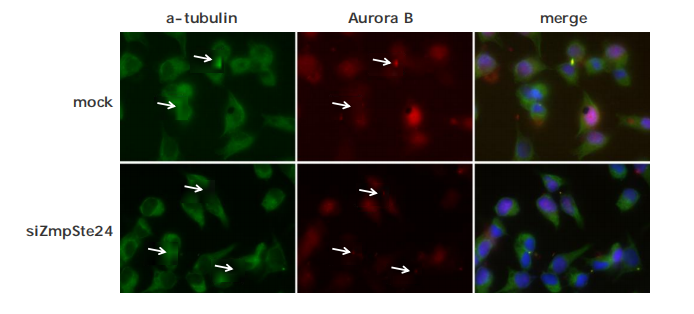
Co-localization of protein of your interest with IF
Metabolite imaging
(1) Microelectrode
This technique is used to measure the intracellular concentrations of common inorganic ions, such as H+, Na+, K+, Cl–, and Ca2+
these microelectrodes are not ideally suited to record the rapid and transient changes in the concentration
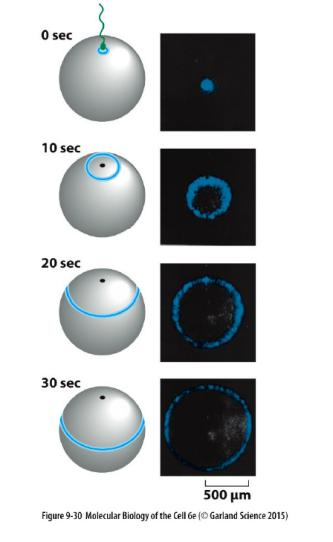
Such changes can be analyzed with ion-sensitive indicators, whose light emission reflects the local concentration of the ion
(2) Protein
Aequorin, a luminescent protein
that glows blue in the presence of Ca2+
Fura-2 can sense free Ca2+ ions in cells
1 | |
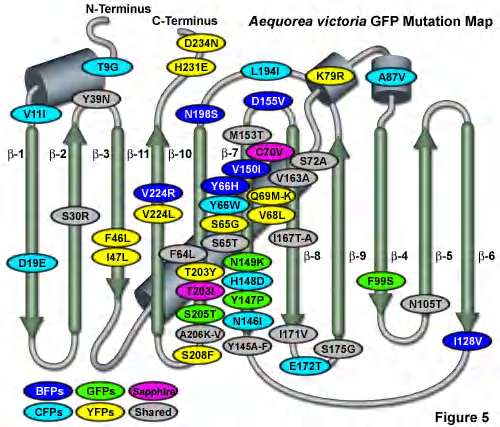
Many spectral variants of GFP are available… All variants result from point mutations in the “original GFP” sequence
Some Techniques:
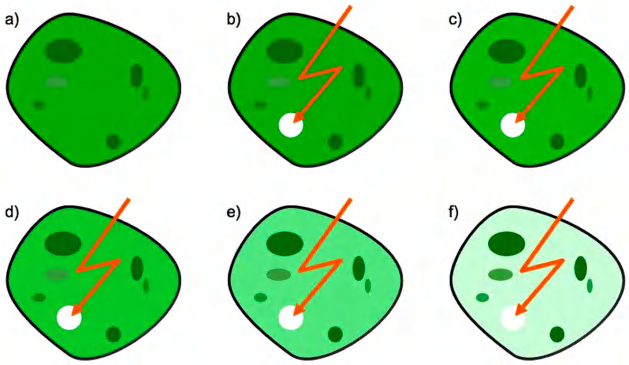
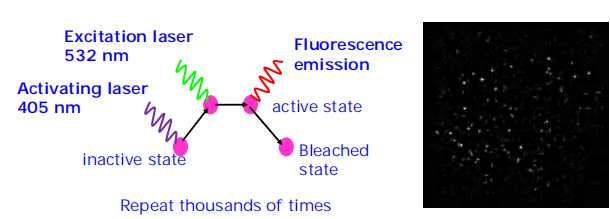
Photo-activated GFP
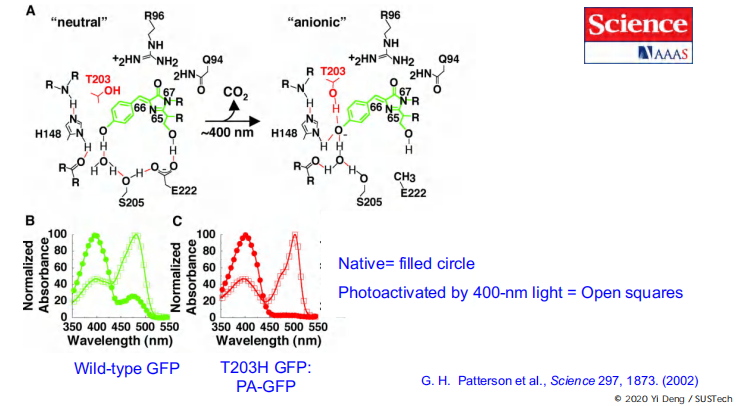
Activate a target molecule by photoactivation, as time goes, the fluorescence signal changes.
It can be used to monitor dynamic processes like protein trafficking, turnover, degradation, diffusion, etc.
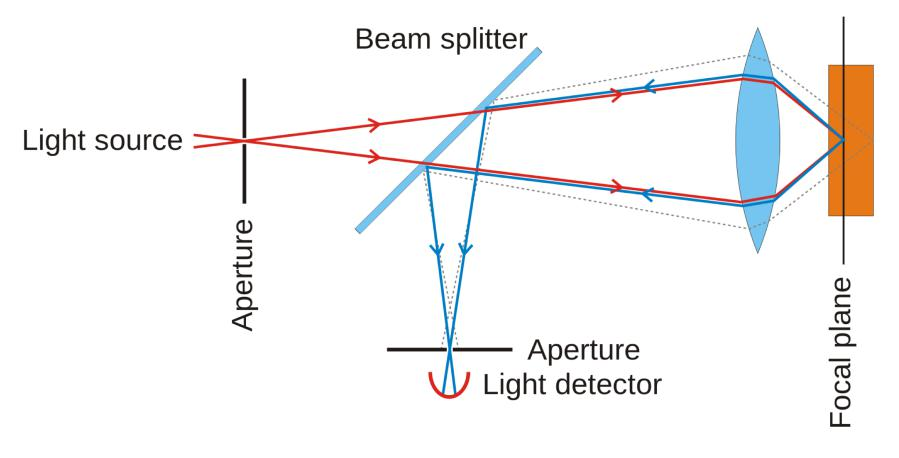
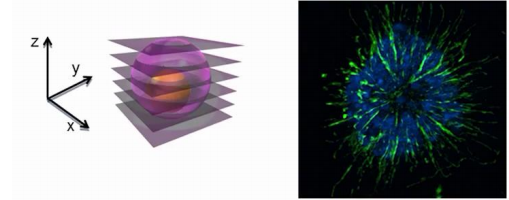
Confocal microscopy
A kind of fluorescence microscopy
- The confocal microscope achieves a result similar to that of deconvolution, but does so by manipulating the light before it is measured
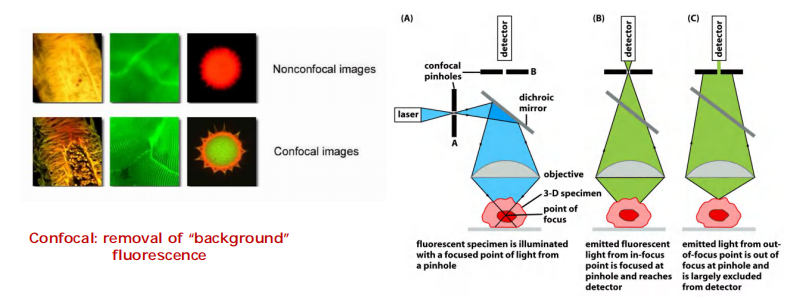
The of focus light is excluded from detection! (对焦光被排除在检测之外)
More accurately detection of protein localization in a 3-D location.
Use laser beam as light source provide better resolution.
- To build up a two-dimensional image, data from each point in the plane of focus are collected sequentially by scanning across the field from left to right in a regular pattern of pixels and are displayed on a computer screen.
- The confocal microscope has been used to resolve the structure of numerous complex three-dimensional objects
Confocal microscopes tend to be better for thicker specimens with high levels of out-of-focus light.
The cooled CCD or CMOS cameras used for deconvolution systems are extremely efficient at collecting small amounts of light, and they can be used to make detailed three-dimensional images from specimens that are too weakly stained or too easily damaged by the bright light used for confocal microscopy
Both methods, however, have another drawback; neither is good at coping with very thick specimens
Deconvolution methods quickly become ineffective any deeper than about 40 μm into a specimen, while confocal microscopes can only obtain images up to a depth of about 150 μm
(1) Laser scanning confocal microscope
Pros: better resolution (Scanning sample point by point)
Cons: Illumination on specimen for longer time, sometime cause bleaching for fluorescence signal (Easily bleached)
Photobleaching Related Techniques
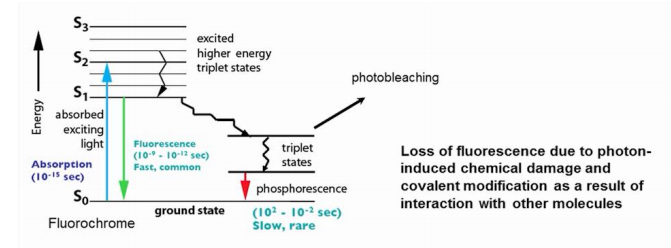
Loss of fluorescence due to photon-induced chemical damage and covalent modification as a result of interaction with other molecules
(1) Fluorescence recovery after photobleaching (FRAP)
FRAP is used to detect movement of molecules.
Fluorescence is destroyed (bleached) in a selected region first.
Then it is observed whether and how fast the fluorescence reappears.
This is then due to arrival of new fluorescent molecules in that selected region.
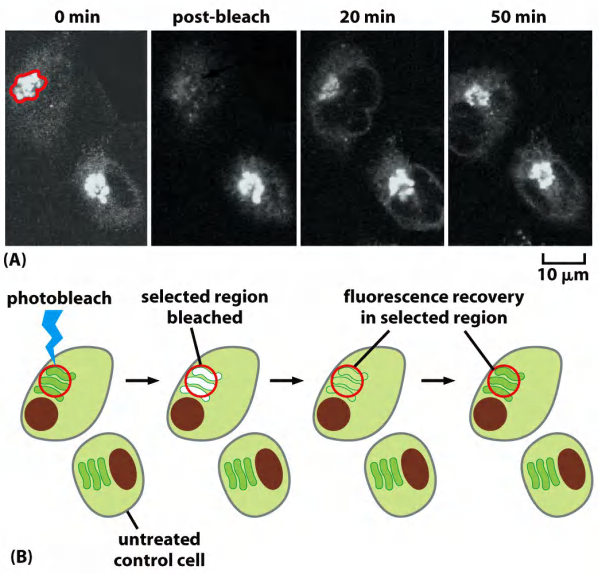
Detect molecular movement
- This technique is usually carried out with a confocal microscope and, like photoactivation, can deliver valuable quantitative data about a protein’s kinetic parameters, such as diffusion coefficients, active transport rates, or binding and dissociation rates from other proteins
(2) Fluorescence loss in photobleaching (FLIP)
FLIP is also used to detect movement of molecules.
Fluorescence is destroyed (bleached) in a selected region continuously by a a laser beam.
Then it is observed whether and how fast the total fluorescence disappears in the cell.
This is then due to arrival of fluorescent molecules in other areas of cell to the selected region, which would be bleached.
Detect molecular movement
(3) Fröster-resonance energy transfer (FRET) microscopy
Rules for choosing the two fluorophores:
Emission spectrum of one must overlap with the excitation spectrum of the other.
- The emission spectrum of one fluorochrome, the donor, overlaps with the absorption spectrum of the other, the acceptor.
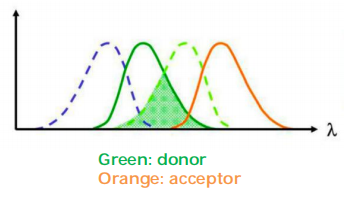
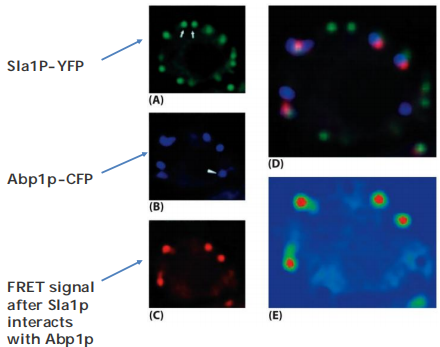
Energy transferred from donor to acceptor, useful to study protein-protein interaction in cell.
FRET occurs only in close distance (<10 nm).
The FRET can be measured by quantifying the reduction of the donor fluorescence in the presence of the acceptor.
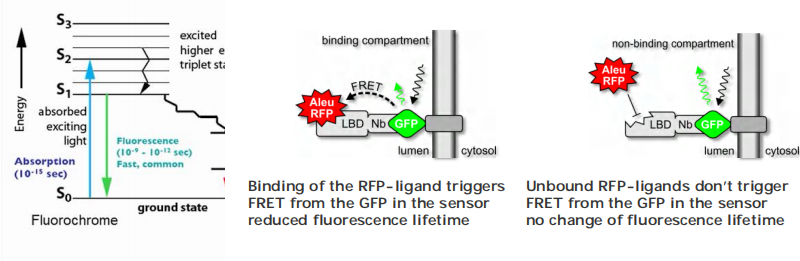
(4) Fluorescence lifetime imaging microscopy (FLIM)
What is fluorescence lifetime?
Use fluorescence lifetime microscopy (FLIM) to detect FRET between GFP-Sensor (donor) and RFP-Ligand (acceptor).
(5) Total internal reflection (TIRF)
Single Molecules Can Be Visualized by Total Internal Reflection Fluorescence Microscopy
In a TIRF microscope, laser light shines onto the cover-slip surface at the precise critical angle at which total internal reflection occurs
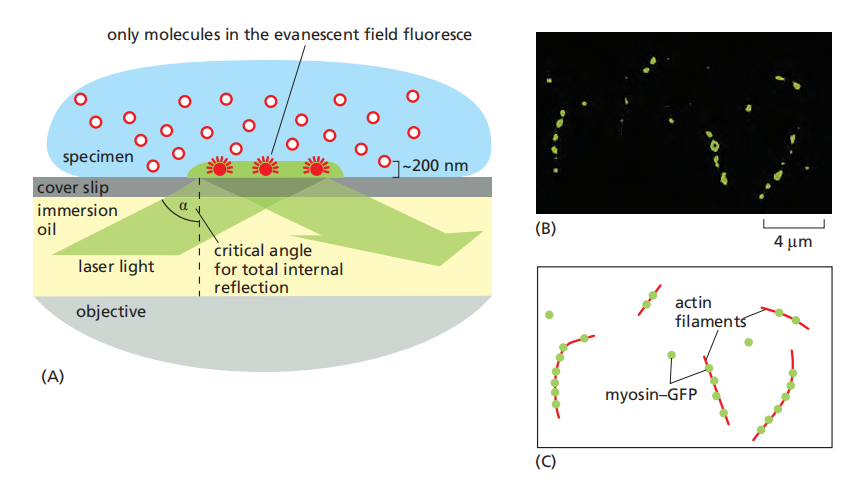
Because of total internal reflection, the light does not enter the sample, and the majority of fluorescent molecules are not, therefore, illuminated
- However, electromagnetic energy does extend, as an evanescent field, for a very short distance beyond the surface of the cover slip and into the specimen, allowing just those molecules in the layer closest to the surface to become excited. (Only excite in-focus molecules)
the technique is restricted to a thin layer within only 100–200 nm of the cell surface
6. Other High-tech Microscopy – Obtaining sharper images
Deconvolution microscopy 反卷积显微镜
Use computer-based algorithms to remove out of focus fight
- The computational approach is often called image deconvolution
- For deconvolution, we first obtain a series of (blurred) images, usually with a cooled CCD camera or more recently a CMOS camera, focusing the microscope in turn on a series of focal planes - in effect, a (blurred) three-dimensional image
- Digital processing of the stack of digital images then removes as much of the blur as possible
7. Super-resolution Fluorescence microscopy
Goal: obtain sub-100 nm resolution
Two methods:
- Spatially patterned excitation STED, SIM
- Localization methods STORM, PALM, FPALM
Structured illumination microscopy (SIM)
- Resolution is about 100nm
Take use of the Moiré Pattern (莫尔条纹)
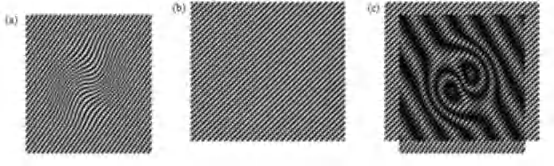
SIM is a fluorescence imaging method with a resolution of about 100 nm, or twice the resolution of conventional bright-field and confocal microscopy
SIM overcomes the diffraction limit by using a grated or structured pattern of light to illuminate the sample.
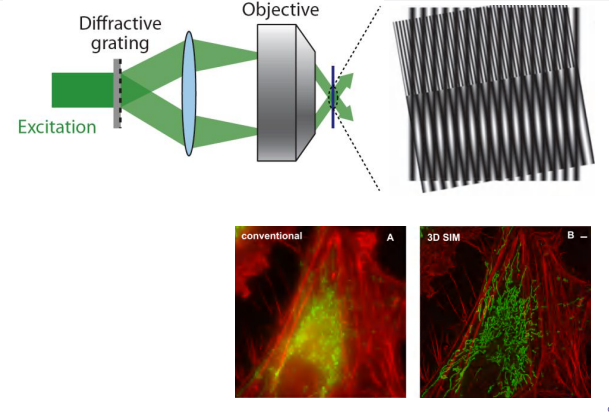
Illumination by a grid means that the parts of the sample in the dark stripes of the grid are not illuminated and therefore not imaged, so the imaging is repeated several times (usually three) after translating the grid through a fraction of the grid spacing between each image.
The whole process is repeated with the grid pattern rotated through a series of angles to obtain an equivalent enhancement in all directions. Finally, mathematically combining all these separate images by computer creates an enhanced super-resolution image.
SIM is versatile because it can be used with any fluorescent dye or protein, and combining
SIM images captured at consecutive focal planes can create three-dimensional data sets
The point spread function is the distribution of light intensity within the three-dimensional, blurred image that is formed when a single point source of light is brought to a focus with a lens.
Stimulated emission depletion microscopy (STED)
- Resolution is about 20 nm
The fluorescent probes used must be in a special class that is photoswitchable: their emission can be reversibly switched on and off with lights of different wavelengths.
As the specimen is scanned with this arrangement of lasers, fluorescent molecules are switched on and off, and the small point spread function at each location is recorded.
The diffraction limit is breached because the technique ensures that similar but very closely spaced molecules are in one of two different states, either fluorescing or dark. This approach is called STED (stimulated emision depletion microscopy)
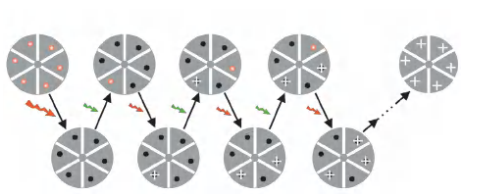
The principle of PALM/STORM
Every time only active some of the molecules to avoid the overlapping light (Separating over time). The focus on the location but not the resolution.
- Arrange for only a very few, clearly separated molecules to actively fluoresce at any one moment. The exact position of each of these can then be computed, before subsequent sets of molecules are examined.
- In practice, this can be achieved by using lasers to sequentially switch on a sparse (稀疏的) subset of fluorescent molecules in a specimen containing photoactivatable or photo-switchable fluorescent labels
- Each molecule emits a few thousand photons in response to the excitation before switching off, and the switching process can be repeated hundreds or even thousands of times, allowing the exact coordinates of a very large set of single molecules to be determined.
- The full set can be combined and digitally displayed as an image in which the computed location of each individual molecule is exactly marked.
This class of methods has been variously termed photoactivated localization microscopy (PALM) or stochastic optical
reconstruction microscopy (STORM).
Localizing is more precise than the resolution
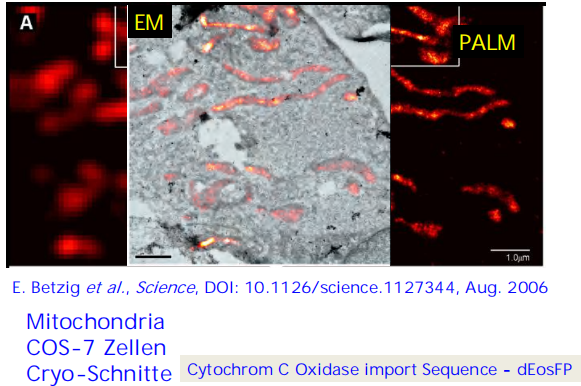
(1) Further Introduction to Photo-activated localization microscopy (PALM)
Eric Betzig et al Imaging intracellular fluorescent proteins at nanometer resolution Science 313, 1642 (2006).
- Express protein of interest tagged with a photo-activatable fluorescent protein in cell
- Stochastically photo-activate a low density of molecules per frame and localize using Gaussian function
(2) Stochastic Optical Reconstruction Microscopy (STORM)
(3) Comparisions between STED and STORM/PALM
In STED, the locations of the molecules are determined by using optical methods to define exactly where their fluorescence will be on or off
In PALM and STORM, individual fluorescent molecules are switched on and off at random over a period of time, allowing their positions to be accurately determined.
All these methods are now being extended to incorporate multicolor imaging, three-dimensional imaging (Figure 9–39), and live-cell imaging in real time.
8. Atomic Force Microscopy (AFM)
In an AFM device, an extremely small and sharply pointed tip, often of silicon or silicon nitride, is made using nanofabrication methods
The tip of the AFM probe is attached to a springy cantilever arm mounted on a highly precise positioning system that allows it to be moved over very small distances
AFM device is able to collect information about a variety of forces that it encounters—including electrostatic, van der Waals, and mechanical forces
- revealing any objects such as proteins or other molecules that might be present on the otherwise flat surface
AFM can also be used to pick up and move single molecules that adsorb strongly to the tip.
- the mechanical properties of individual protein molecules can be measured in detail. For example, AFM has been used to unfold a single protein molecule in order to measure the energetics of domain folding
Electron microscopy
Different concepts for different purposes
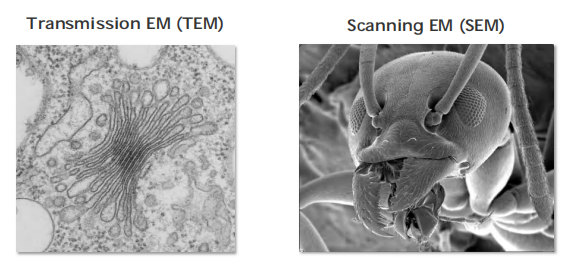
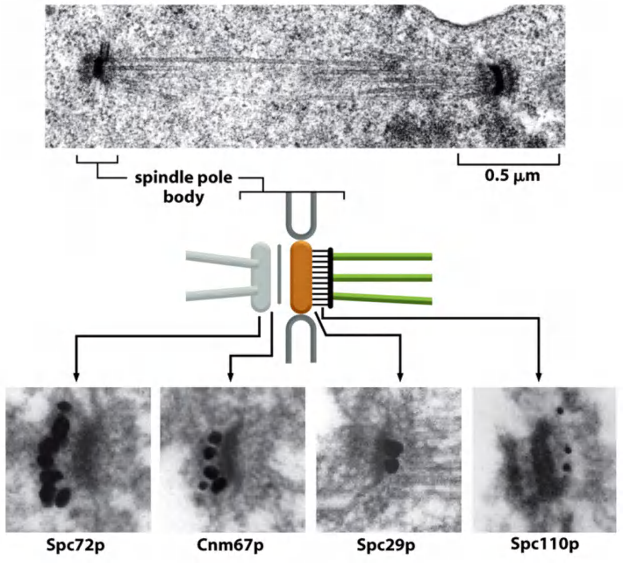
TEM: Used to study detailed intracellular organization
SEM: Study the surface of the sample
problems of specimen preparation, contrast, and radiation damage have generally limited the normal effective resolution for biological objects to 1 nm (10 Å).
1. Principle & features
Electrons penetrate the specimen
Produce high resolution images
Observed subcellular organelles, virus structure, etc.
More expensive (no-not true anymore)
Special preparation of the sample required
- Some of the electrons passing through the specimen are scattered by structures stained with the electron-dense material; the remainder are focused to form an image
- Because the scattered electrons are lost from the beam, the dense regions of the specimen show up in the image as areas of reduced electron flux, which look dark.
2. Sample Preparation
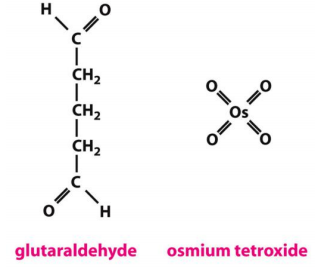
Chemical Fixation and Sectioning
- first with glutaraldehyde (戊二醛), which covalently cross-links protein molecules to their neighbors
- then with osmium tetroxide (四氧化锇), which binds to and stabilizes lipid bilayers as well as proteins
- Because electrons have very limited penetrating power, the fixed tissues normally have to be cut into extremely thin sections (25–100 nm thick, about 1/200 the thickness of a single cell) before they are viewed
- This is achieved by dehydrating the specimen, permeating it with a monomeric resin (单体树脂) that polymerizes to form a solid block of plastics
- then cutting the block with a fine glass or diamond knife on a special microtome.
Rapid Freezing Fixation
Electron microscopy samples are always chemically fixed before dehydration, resin-embedding, and sectioning.
They can also be fixed by rapid freezing, in a way that precludes ice-crystal formation, to ensure minimal damage to the original call structures.
This can be done by:
- High-pressure cooling
- Plunging into liquid nitrogen
- Spraying with a jet of liquid propane
- Contact with a copper block cooled by liquid helium
Heavy Metal Impregnation
Biological tissues are composed mainly of atoms of very low atomic number (primarily carbon, oxygen, nitrogen, and hydrogen).
- To make them visible, tissues are usually impregnated (before or after sectioning) with the salts of heavy metals such as uranium, lead, and osmium
3. Ultrastructural analysis (TEM)
Always: Dehydrated specimen (no live cell imaging possible).
Sample has to be dehydrated and ultra thin sliced
- 50-100 nm thick (penetrating power for electron is very weak)
Sample is usually rapidly frozen to preserve its original state and to prevent formation of hexagonal ice crystals by high-pressure freezing (HPF).
Sometimes, chemical fixation with Glutaraldehyde (to crosslink proteins) and Osmium tetroxide (to stabilize lipid membranes)
Contrast can be enhanced by using heavy metals (uranyl-acetate and lead-citrate)
Dehydration of the sample
Resin(树脂、松香)-embedding
Fixatives for specimen preparation EM are extremely dangerous
All chemicals that are used to fix the cells or to enhance the contrast are very toxic!
ALWAYS: Carefully check all instructions and procedures
4. Immunogold electron microscopy (IEM)
Specific Macromolecules Can Be Localized by Immunogold Electron Microscopy
The usual procedure is to incubate a thin section first with a specific primary antibody, and then with a secondary antibody to which a colloidal gold particle has been attached.
A complication for immunogold labeling is that the antibodies and colloidal gold particles do not penetrate into the resin used for embedding; therefore, they detect antigens only at the surface of the section
- One solution is to label the specimen before embedding it in plastic, when cells and tissues are still fully accessible to labeling reagents.
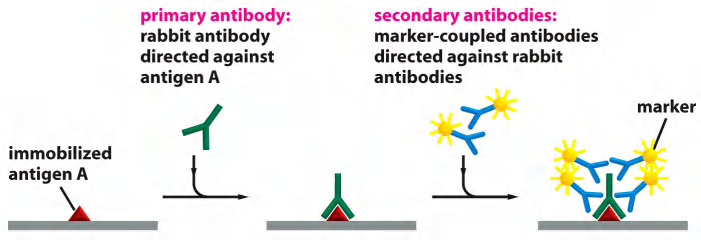
Immunodetection of proteins via antibodies
- Specific protein binds with its primary antibody
- Gold particle-conjugated secondary antibody is incubated to label the primary antibody with a gold particle.
- Gold is electron-dense and appears as black dot
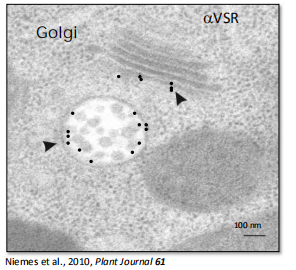
Images of immunogold electron microscope
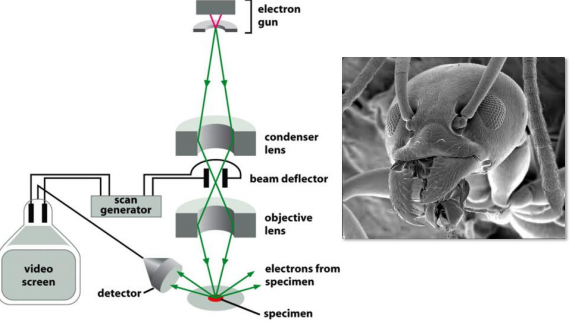
5. Scanning Electron microscopy (SEM)
A scanning electron microscope (SEM) directly produces an image of the three-dimensional structure of the surface of a specimen
Principle & features
Produces 3-D structure for the surface of a specimen.
- Only surface features can be examined, however, and in most forms of SEM, the resolution attainable is not very high (about 10 nm, with an effective magnification of up to 20,000 times). As a result, the technique is usually used to study whole cells and tissues rather than subcellular organelles
Uses electrons that are scattered or emitted from the specimen’s surface.
- Lower resolution ~ 10 nm
- Usually whole cells or tissues, not subcellular organelles.
6. electron-microscope (EM) tomography
Because of the large depth of field of electron microscopes, all the parts of the three-dimensional specimen are in focus
The resulting image is a projection (a superimposition of layers) of the structure along the viewing direction
- The lost information in the third dimension can be recovered if we have views of the same specimen from many different directions.
In electron-microscope (EM) tomography, we can arrive at a three-dimensional reconstruction, in a chosen standard orientation, by combining different views of a single object.
7. Cryoelectron Microscopy
An alternative that allows us to visualize directly at high resolution even the interior features of three-dimensional structures such as viruses and organelles is cryoelectron microscopy, in which rapid freezing to form vitreous ice is again the key
- A special sample holder keeps this hydrated specimen at –160°C in the vacuum of the microscope, where it can be viewed directly without fixation, staining, or dryings
hydrated cryoelectron microscopy produces an image from the macromolecular structure itself. However, the contrast in this image is very low, and to extract the maximum amount of structural information, special image-processing techniques must be used
8. EM VS. X-Ray Crystallography
- First, it does not absolutely require crystalline specimens.
- Second, it can deal with extremely large complexes—structures that may be too large or too variable to crystallize satisfactorily.
- Third, it allows the rapid analysis of different conformations of protein complexes.
二、Processing and Digital Techniques
Image Processing
1. Camera
image processing, have had a major impact on light microscopy
These cameras detect light by means of charge-coupled devices (CCDs), or high sensitivity complementary metal-oxide semiconductor (CMOS) sensors, similar to those found in digital cameras
Such image sensors are 10 times more sensitive than the human eye and can detect 100 times more intensity levels.
2. Single-Particle Reconstruction
The solution is to obtain images of many identical molecules—perhaps tens of thousands of individual images—and combine them to produce an averaged image, revealing structural details that are hidden by the noise in the original images.
This procedure is called single-particle reconstruction
Fixation and Section Before Microscopy
Common fixatives include glutaraldehyde, which forms covalent bonds with the free amino groups of proteins, cross-linking them so they are stabilized and locked into position.
Because tissues are generally soft and fragile, even after fixation, they need to be either frozen or embedded in a supporting medium before being sectioned. The usual embedding media are waxes or resins.
The dye hematoxylin, for example, has an affinity for negatively charged molecules and therefore reveals the distribution of DNA, RNA, and acidic proteins in a cell
Staining
If they are shadowed with a heavy metal to provide contrast, isolated macromolecules such as DNA or large proteins can be visualized readily in the electron microscope, but negative staining allows finer detail to be seen
Shadowing and negative staining can provide high-contrast surface views of small macromolecular assemblies, but the size of the smallest metal particles in the shadow or stain used limits the resolution of both techniques
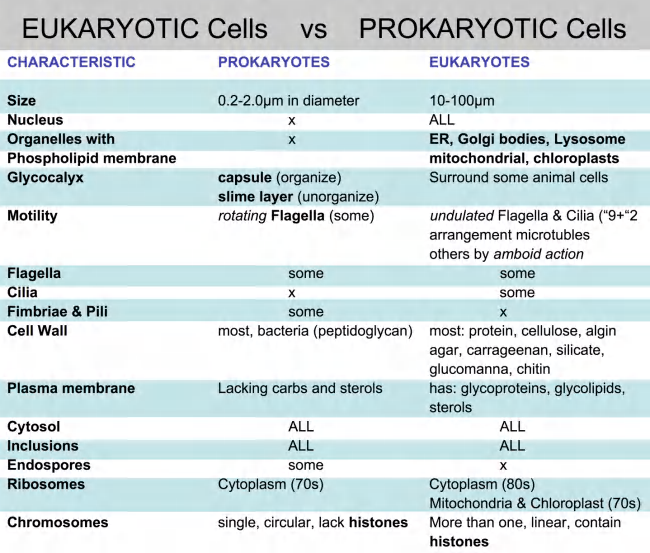
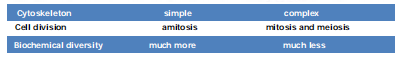
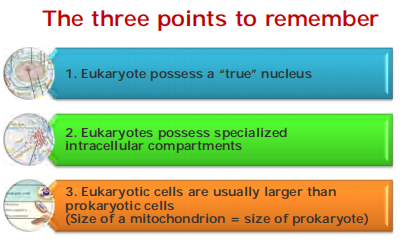
三、Prokaryotic and eukaryotic cells