L4 Drug Receptors & Pharmacodynamics
Pharmacology
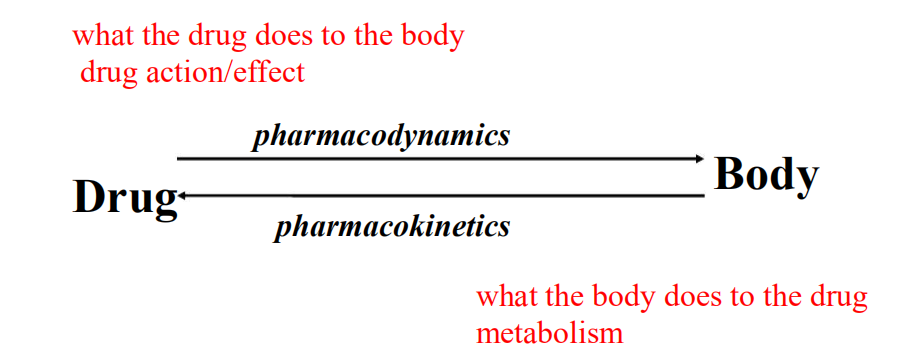
- Processes of drug action that occur when drug reaches site of action and produces an effect.
Pharmocodynamic Phase
Action vs. Effect
- action = how the drug works
- usually by enhancing or inhibiting cell function
- effect = consequence of drug action on body
Example: Aspirin
- action: block prostaglandin Synthesis, via binding and inhibiting cyclooxygenase
- effect: analgesia & antipyresis
How drugs act
Many drugs exert their actions by binding to protein targets on mammalian cells
- Receptors
- Ion channels
- Enzymes
- Carrier molecules
Exceptions
- Antibiotics (protein, DNA or lipid membrane)
- Anti-cancer drugs (similar to above)
- Etc.
Drug and Receptor Interaction
primary way drugs produce an action
RECEPTOR
- The component of a cell or organism that interacts with a drug and initiates the chain of events leading to the drug’s observed effects
Receptor Types
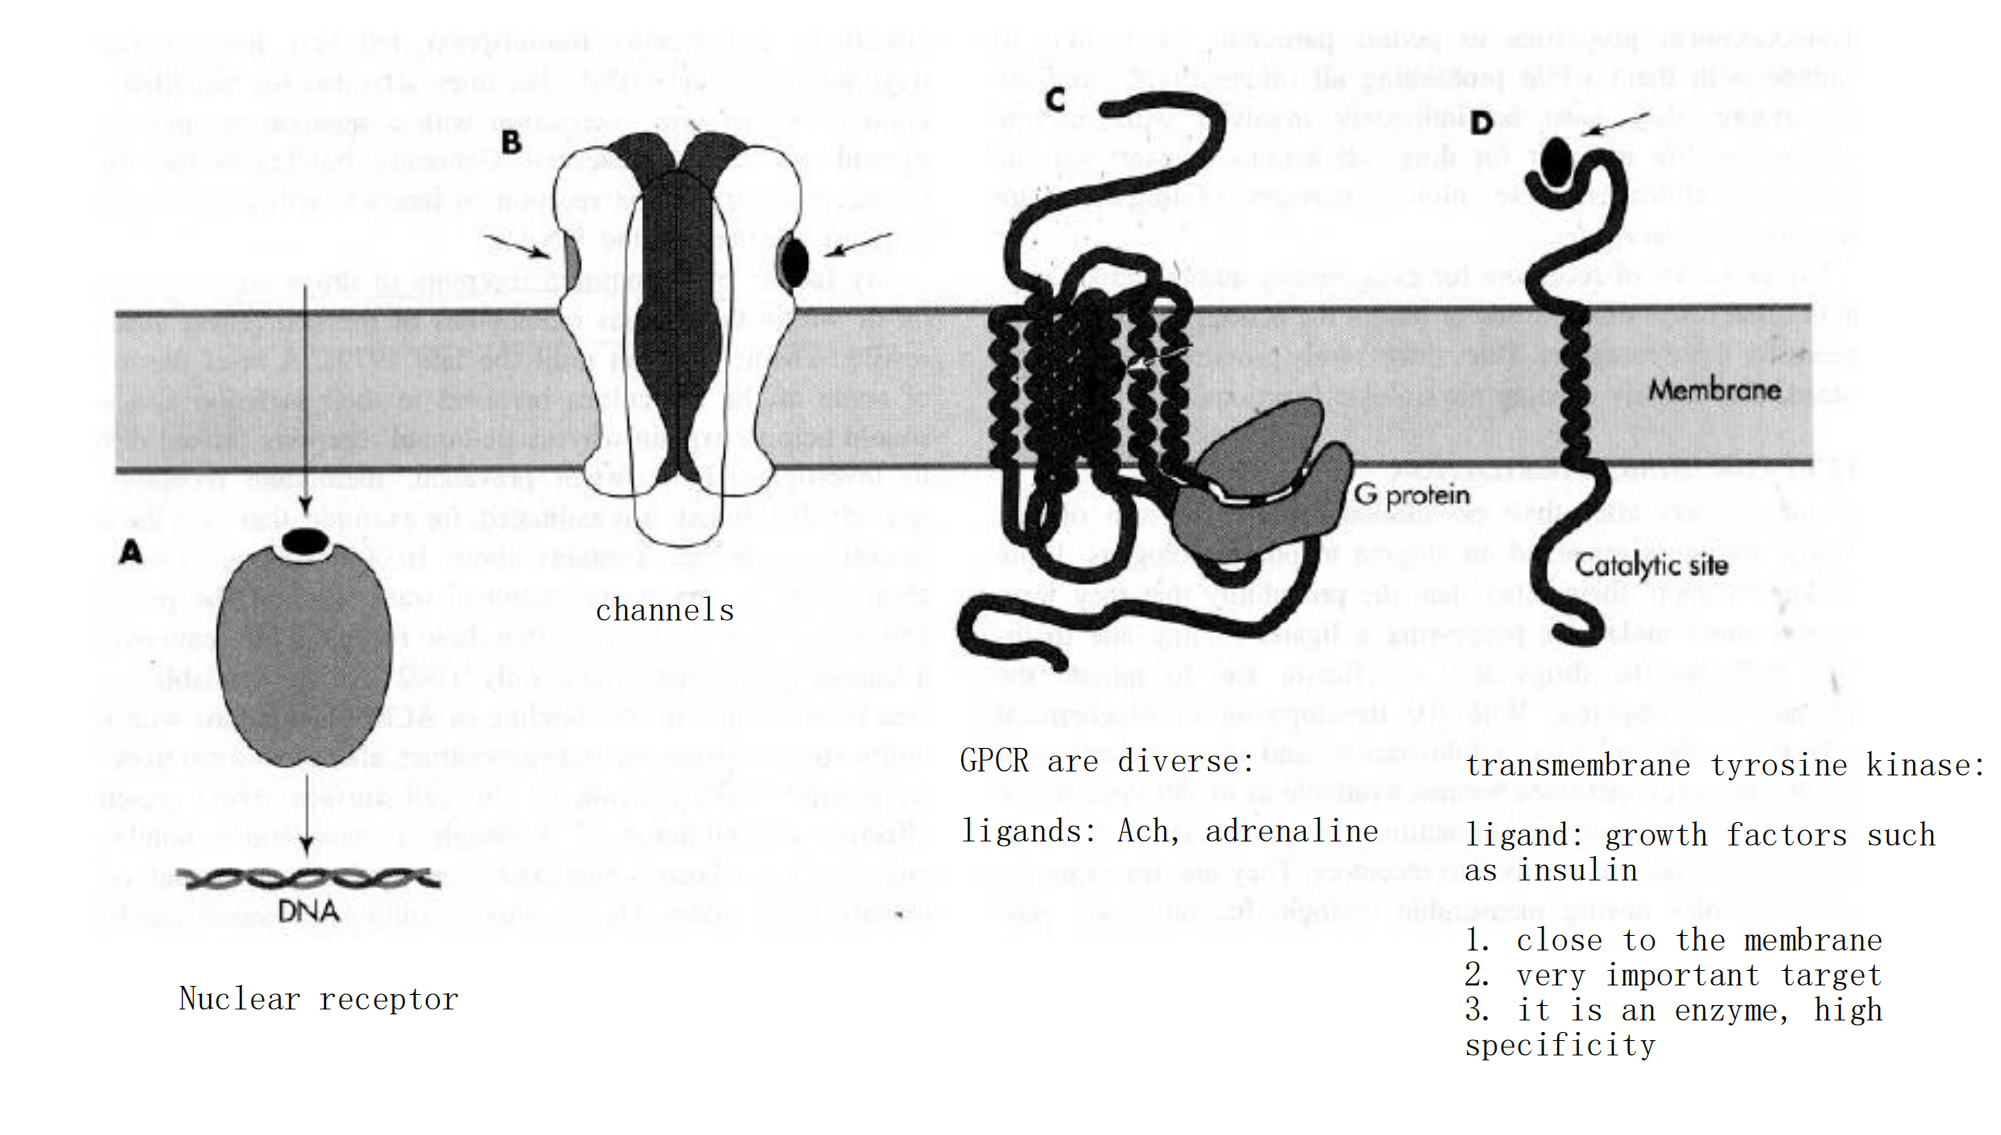
1. Intracellular Receptors for Lipid-Soluble Agents
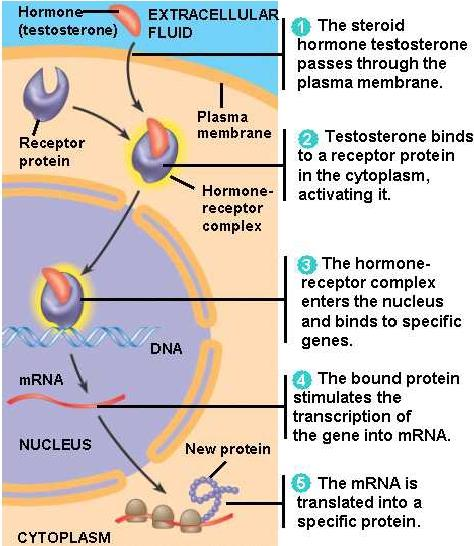
- Several biologic signals are sufficiently lipid-soluble to cross the plasma membrane and act on intracellular receptors.
- The ligands include steroids, sex steroids, vitamin D, and thyroid hormone
Therapeutical consequences of intracellular receptors
- transcription and translation take about 30 min
- All of these hormones (ligands) produce their effects after a period of 30 minutes to several hours
- The effects of these agents can persist for hours or days after the agonist concentration has been reduced to zero
2. Ligand-Gated Channels
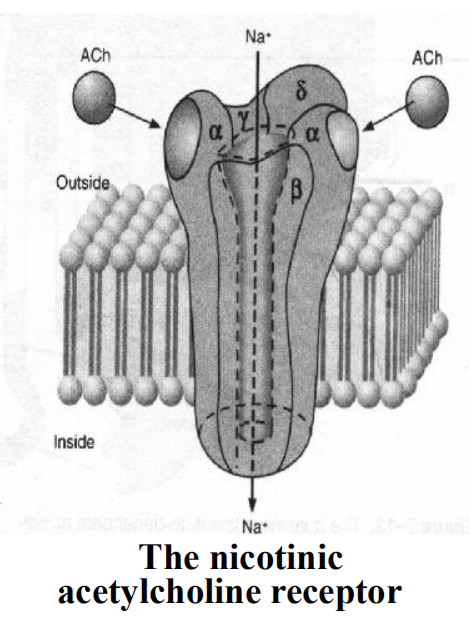
The open of channel results in the flow of ion and thereby alters the electrical potential across the membrane
- The natural ligands including N-acetylcholine, excitatory amino acids (glycine, glutamate, etc), γ-GABA (Cl-, chlorine).
- All of these agents are synaptic transmitters
The time scale of signaling is about milliseconds
The rapidity of this signaling is crucially important for moment transfer of information across synapses
3. G-protein-coupled Receptors
This is the largest receptors family with over a hundred members cloned to date
G-protein: a kind of GTP-binding proteins with subunit of αβγ
Characteristics: seven-times crossing the plasma membrane, use G protein as transducers to convey signal to their effector proteins
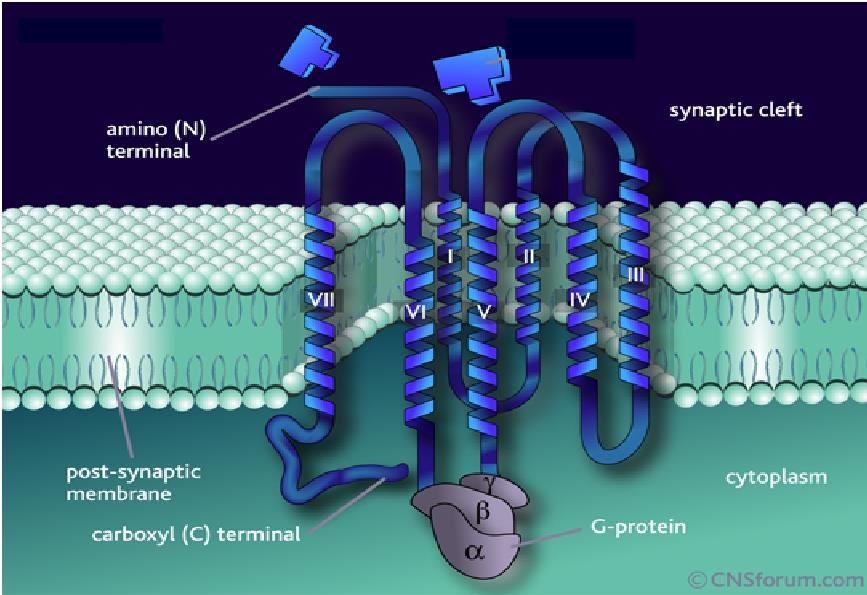
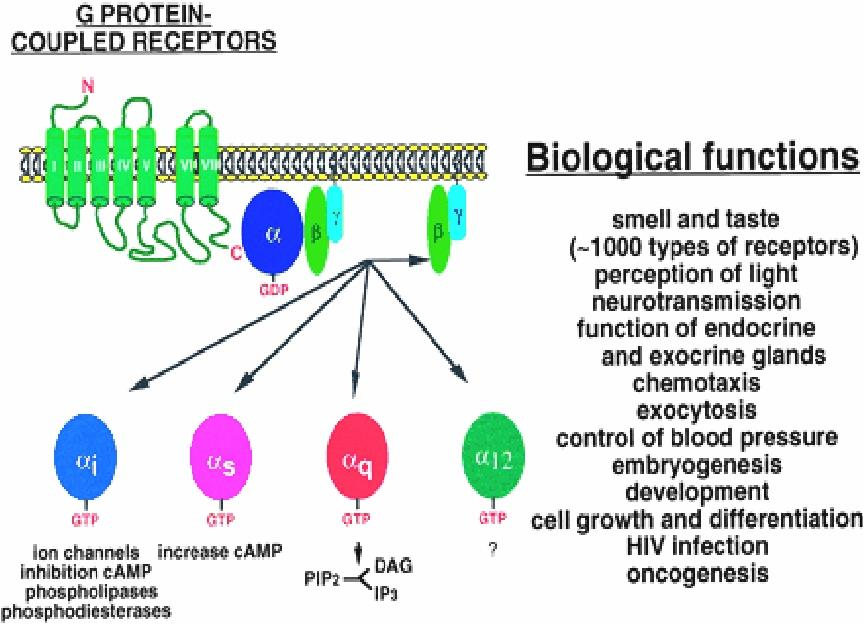
Members: include receptors for many biogenic amines, such as adrenalin, DA, histamine, M-acetylcholine, and others.
G-protein-regulated effectors include enzymes such as adenylyl cyclase and phospholipase C and plasma membrane ion channels.
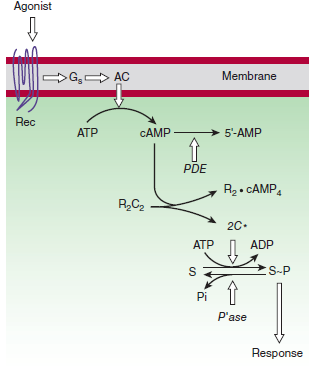
Well-Established Second Messengers
metabolite or ion that diffuse through a cell to convey information
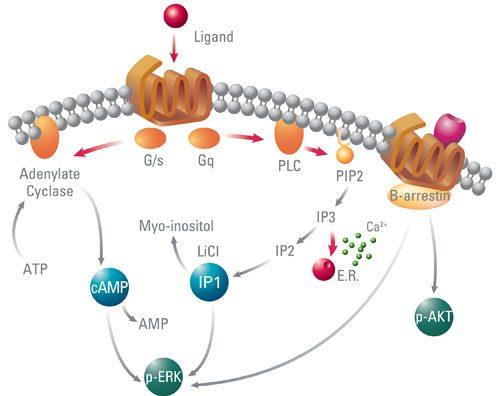
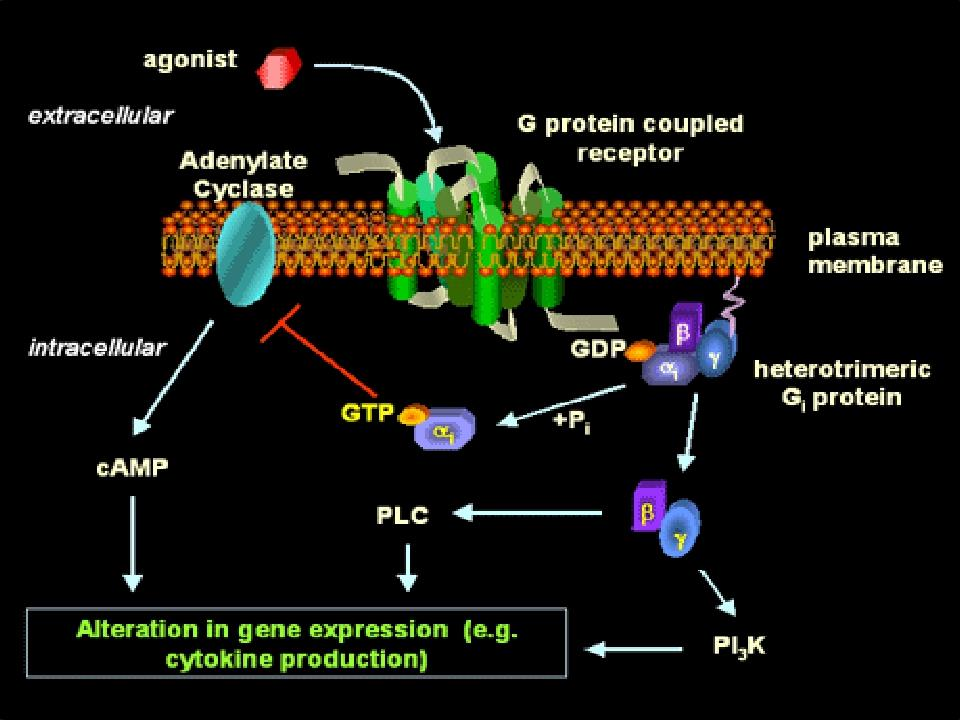
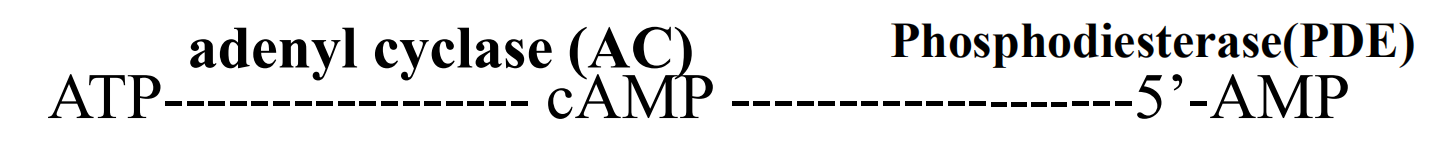
Is synthesized by adenylyl cyclase under the control of many G protein-coupled receptors
Is eliminated by a combination of hydrolysis, catalyzed by phosphodiesterases, and extrusion by several plasma membrane transport proteins
- Activate cyclic AMP-dependent protein kinases (PKA)
- The PKA can phosphorylate both final physiological targets and numerous protein kinases and other regulatory proteins, Including transcription factors to regulate gene expression
Cyclic AMP
These kinases are composed of a cAMP-binding domain and catalytic chains
The PKA can phosphorylate both final physiological targets and numerous protein kinases and other regulatory proteins, including transcription factors
- Regulate gene expression
Calcium and Phosphoinositides
Phospholipase C splits the phosphatidylinositol-4,5-bisphosphate (PIP2) into diacylglycerol (DAG) and inositol-1,4,5trisphosphate (IP3)
- DAG is confined to the membrane and activates a phospholipid and calcium-sensitive protein kinase called protein kinase C.
- IP3 triggers release of Ca2+ from internal storage vesicles
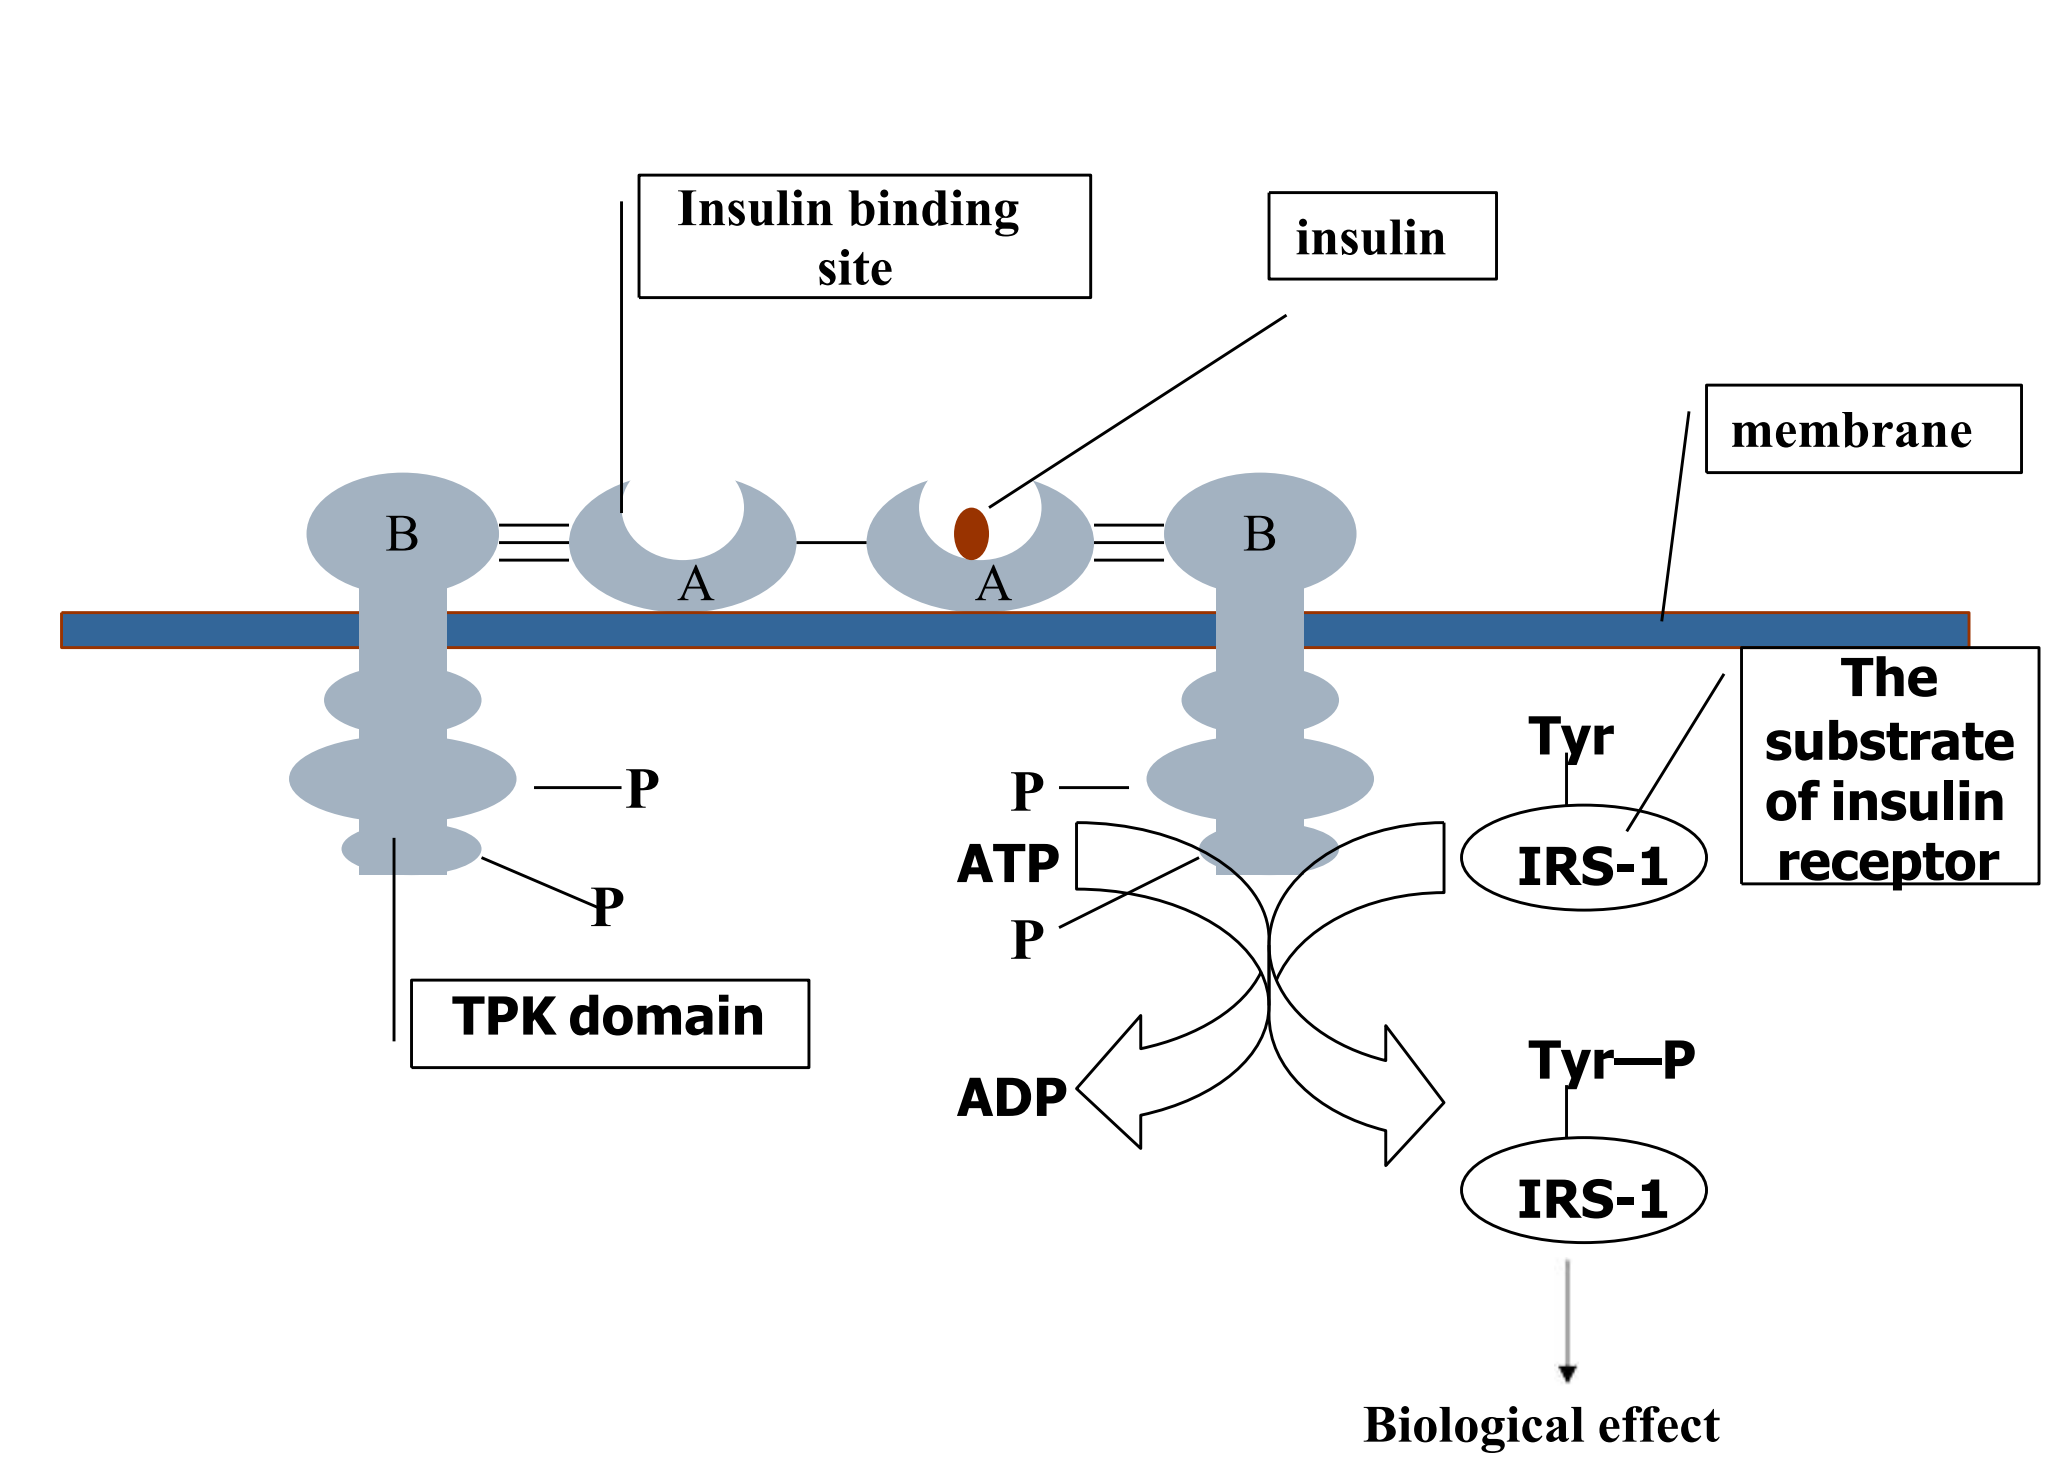
4. Ligand-Regulated Transmembrane Enzymes Including Receptor Tyrosine Kinases
Be composed of an extracelluar ligand-binding domain and a cytoplasmic enzyme domain (protein tyrosine/serine (threonine) kinase or a guanylyl cyclase)
Insulin, epidermal growth factor (EGF), platelet-derived growth factor (PDGF), and many other trophic hormones.
Ligand bind, conformation change, receptors bind to one another, tyrosine residues cross-phosphorylated
Activated receptors catalyze phosphorylation of tyrosine residues in their substrates
Therapeutical consequences
Inhibitors of receptor tyrosine kinases are finding increased use in neoplastic disorders
Ligand binding often induces accelerated endocytosis of receptors from the cell surface and degradation (down-regulation)
Theory and assumptions of drug-receptor interaction
Binding to receptor causes some event which leads to the response.
Response to a drug is graded or dose-dependent.
For a given drug, the magnitude of response is directly proportional to the fraction of total receptor sites occupied by drug molecules (i.e. the occupancy assumption).
The number of drug molecules is assumed to be much greater than the number of receptor sites.
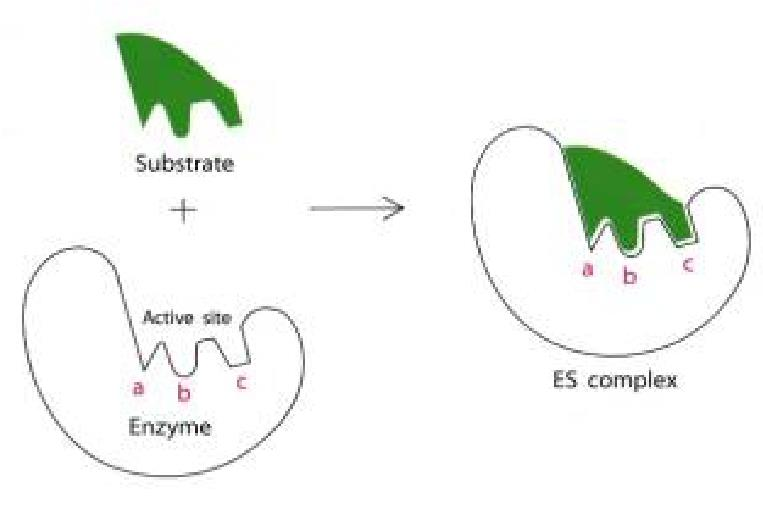
Binding of drug with a receptor produces a specific response. “lock and key”.
Drug-receptor interactions are analogous to enzyme-substrate interactions.
- Endogenous ligands (e.g. enkephalin versus morphine).
- Drugs without specific receptors (e.g. gaseous anesthetics).
Drug and receptor interaction
Drug receptor interaction follows simple mass-action relationships, i.e., only one drug molecule occupies each receptor site and binding is reversible. Can be described with Michaelis Menten equation:
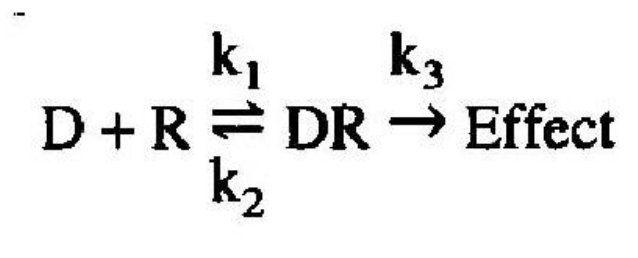
When a drug (D) combines with a receptor (R), it does so at a rate which is dependent on the concentration of the drug and the concentration of the receptor
D = drug
R = receptor,
DR = drug-receptor complex
k1 = rate for association
k2 = rate for dissociation.
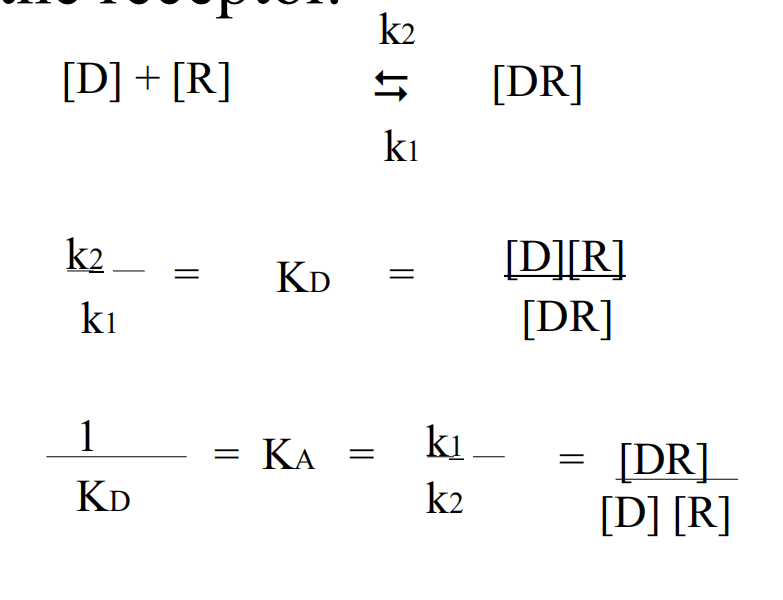
KD = Dissociation Constant
KA = Association Constant
Saturation curve
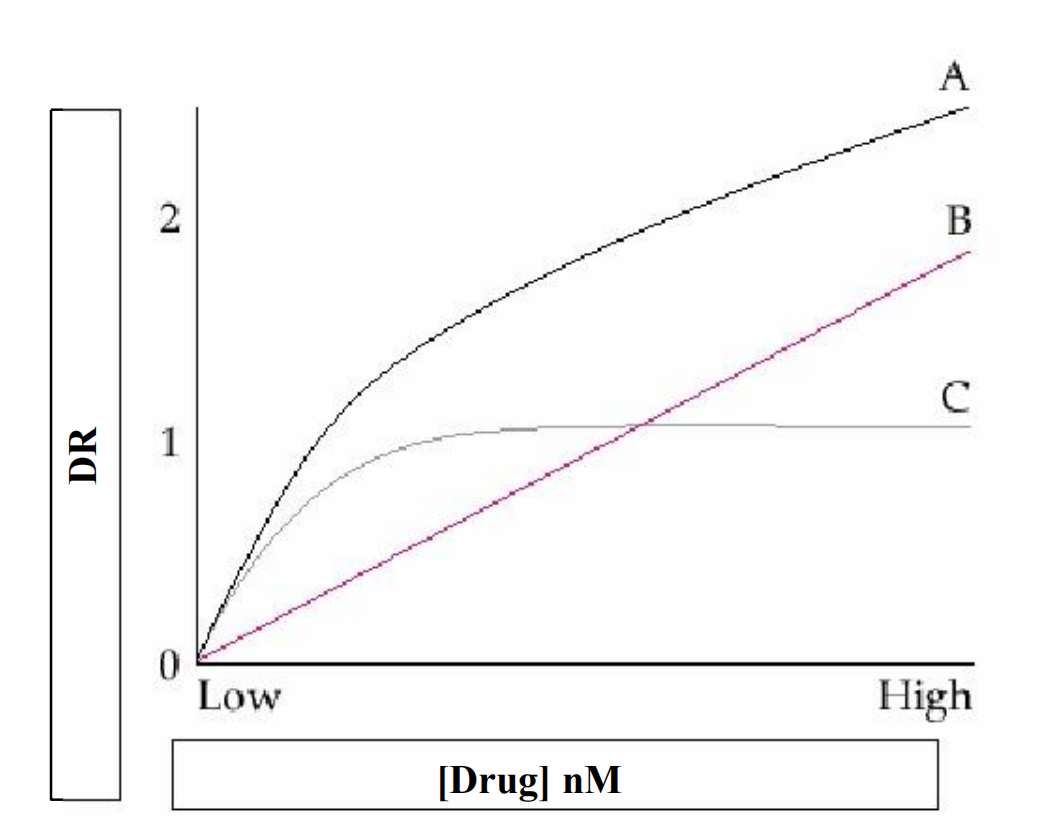
A. Total binding
B. Nonspecific binding
C. Difference=Specific binding
RT= Total number of receptors
Bmax = Maximal number of receptors Bound
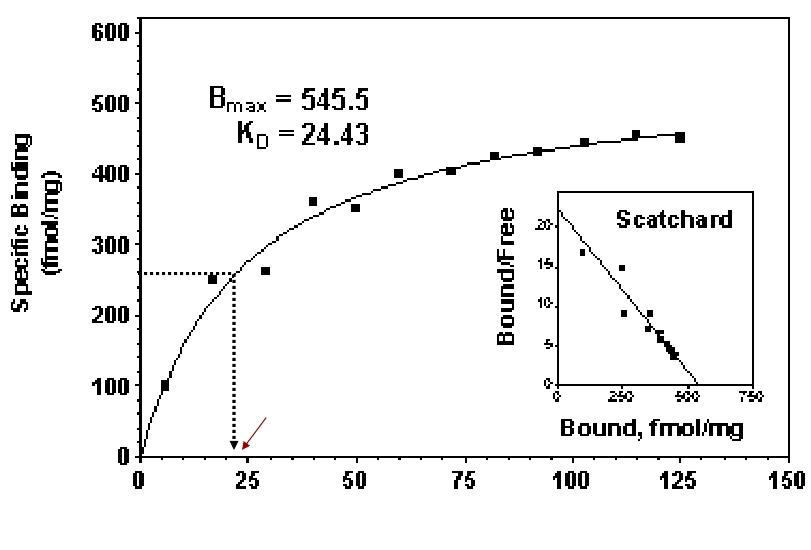
At equilibrium, the dissociation constant is KD and the affinity is KA= 1/KD Thus when [D] =KD, half the total number of receptors will be occupied.
Terminology
Terms which indicate ability of drug to bind to receptor
- Potency
- Affinity (1/KD)
- KD or ED50 (Effective dose 50)
- (Corresponds to Km in Michaelis-Menten analogy)
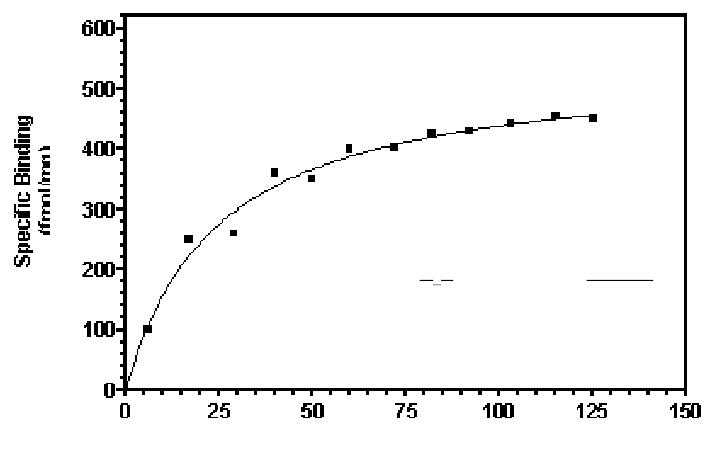
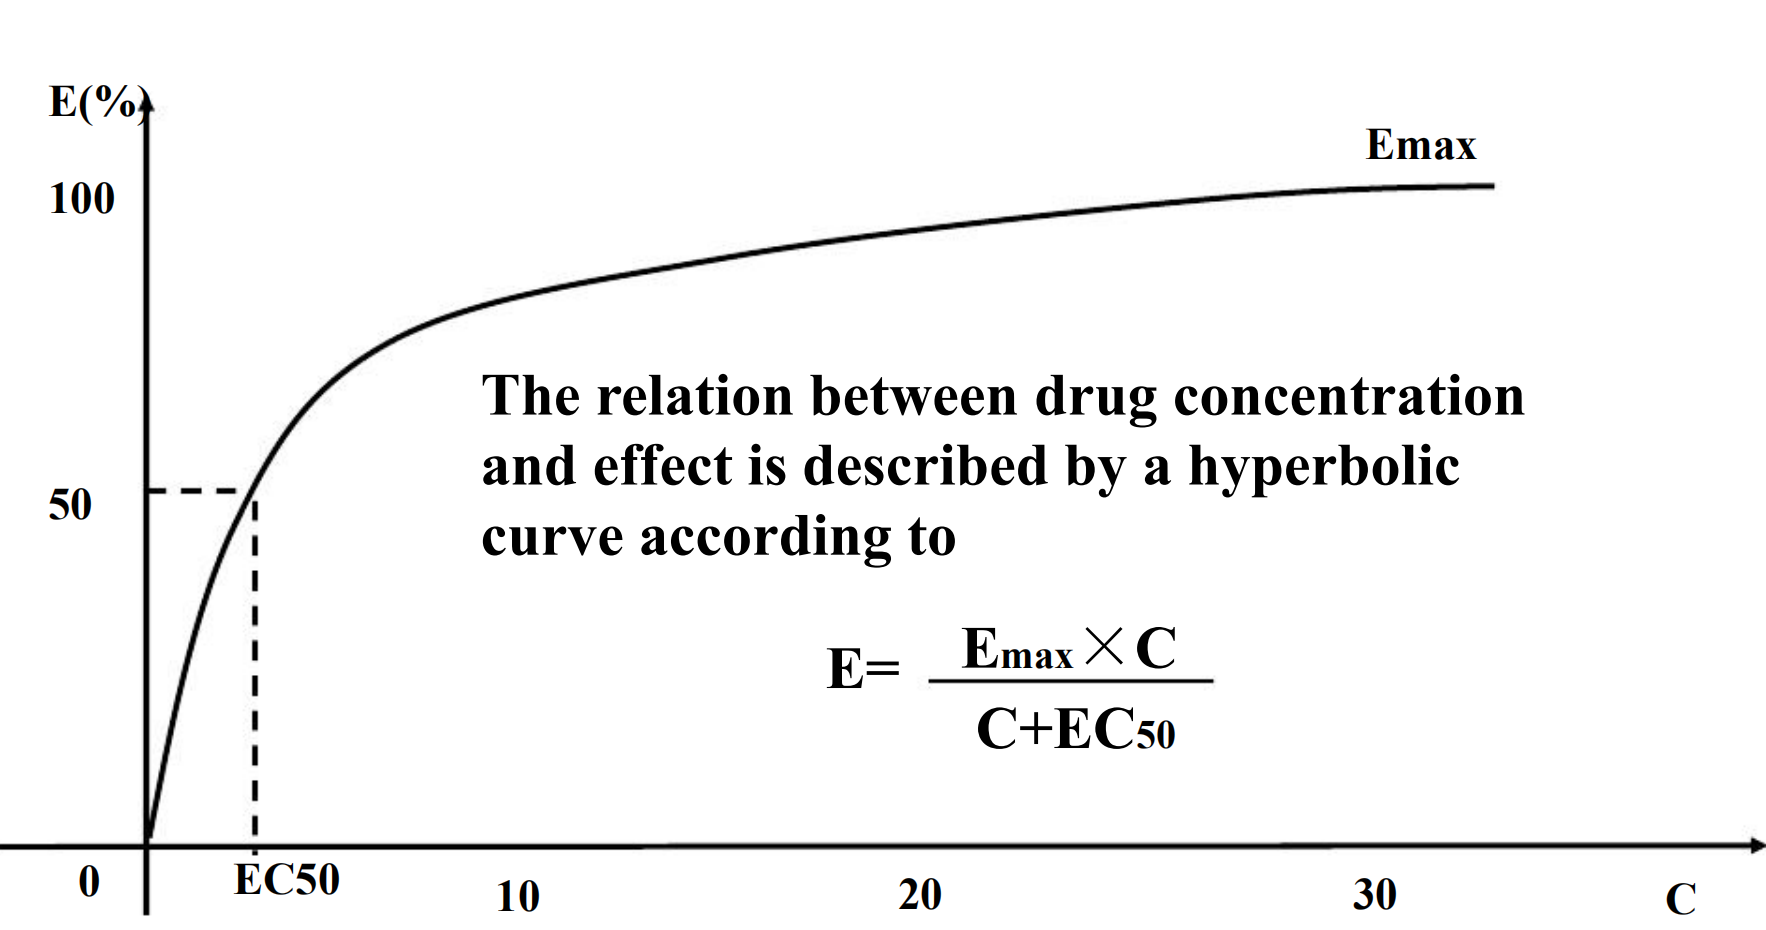
Concentration-Bound Receptors
Bmax indicates the total concentration of receptor sites
KD represents the concentration of free drug at which half-maximal binding is observed
This constant characterizes the receptor’s affinity for binding the drug in a reciprocal fashion
The EC50 and Kd may be identical, but need not be
Relation Between Drug Concentration and Response
D-E relationship of patient
C-E relationship of in vitro system
Concentration-Effect Curves & Receptor Binding of Agonists
Concentration-Effect Curves
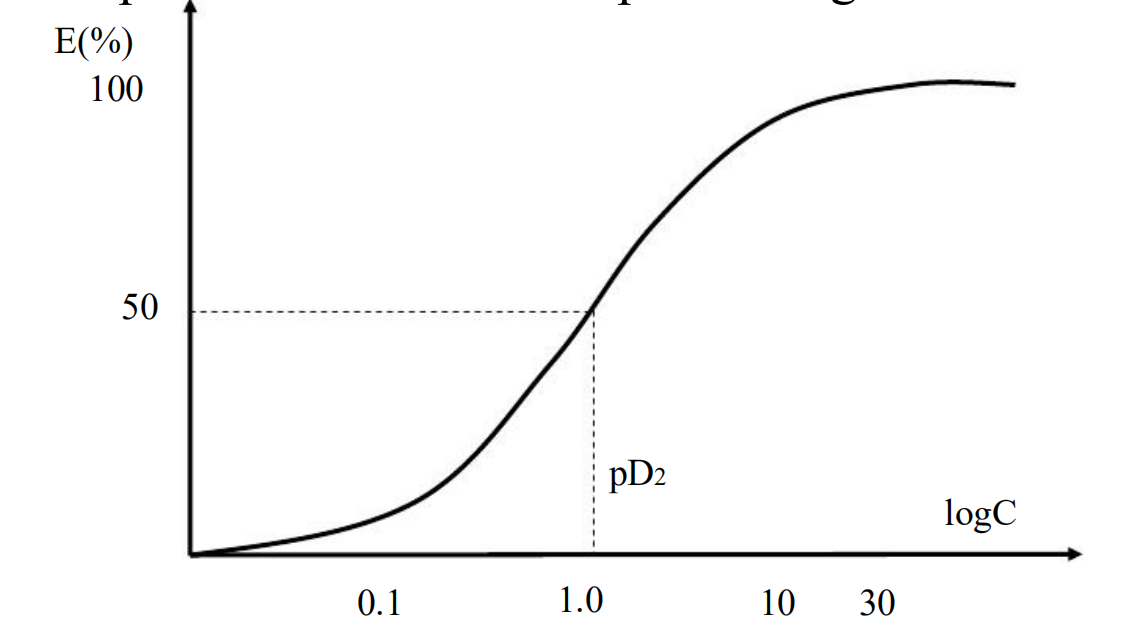
- If plotted the E versus log D or log C, the curve become typical symmetrical sigmoid curve.
- Expands the low and compresses high concentration
Classification of Drugs based on PD
Antagonist
- A pure antagonist, which can bind to receptors without efficacy, antagonizes the biologic effects of the corresponding agonist.
- Competitive & Irreversible Antagonists
- Antagonists are divided into two classes depending on whether or not they reversibly compete with agonists for binding to receptors
- Competitive antagonist
- Noncompetitive/irreversible antagonist
- Competitive antagonist
- Competes the same receptor with agonist and reversibly binds to receptors
- The Emax for the agonist remains the same for any fixed concentration of antagonist
- The presence of antagonist will increase the ED50 of the agonist
- So the D-E curve of agonist will shift to the right
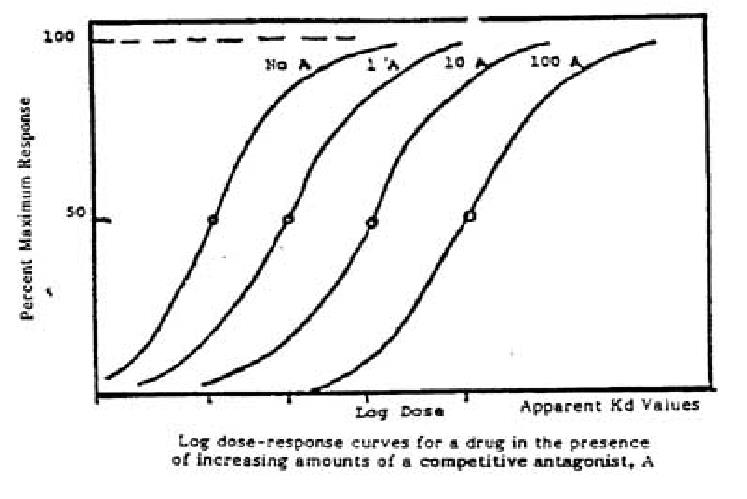
- Therapeutic Implications
- The degree of inhibition produced by a competitive antagonist depends on the concentration of antagonist. D→C
- Clinical response to a competitive antagonist depends on the concentration of agonist that is competing for binding to receptors
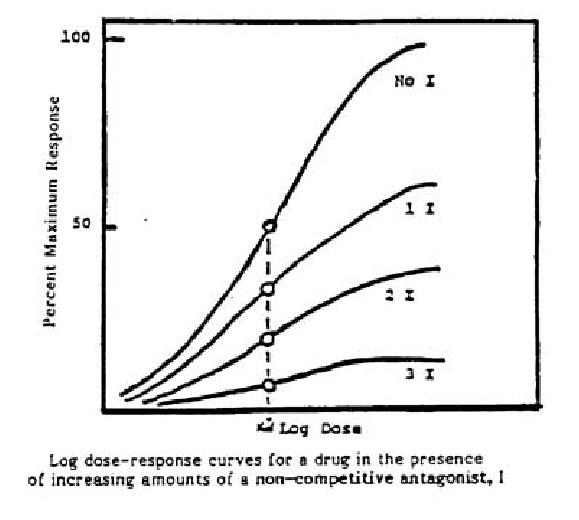
- Non-competitive antagonist
- Irreversibly binds to receptors
- The antagonism can not be overcome by increasing the concentration of the agonist, that is to say the maximal effects of the agonist are depressed by the corresponding noncompetitive antagonist
- make the height of the curve descend.
- Therapeutic Implications
- Therapeutically, irreversible antagonists present distinctive advantages and disadvantages
- Consequently, the duration of action of such an irreversible antagonist is relatively independent of its own rate of elimination and more dependent on the rate of turnover of receptor molecules
Agonist
Can bind to receptors, then activate receptors and produce pharmacological effect.
Agonist I drugs (direct agonists)
- bind to same site as endogenous ligand
- effect? similar to ligand
Agonist II drugs (indirect agonists)
- bind to different cell site
- do not produce effect themselves
- enhance effect of natural ligand
- bind to different cell site
Partial Agonists
Based on the maximal pharmacologic response that occurs when all receptors are occupied, agonist can be divided into two classes:
- Partial agonists produce a lower response, at full receptor occupancy, than do full agonists
- The effects of full agonists can be considered more efficiently coupled to receptor occupancy than can the effects of partial agonists
- Partial agonists produce C-E curves that resemble those observed with full agonists in the presence of irreversible antagonists
- The failure of partial agonists to produce a maximal response is not due to decreased affinity for binding to receptors (low intrinsic activity)
- Partial agonists competitively inhibit the responses produced by full agonists
Dose-effect Relationship
In a certain range of doses, the pharmacological response is increased in proportion with the increase in doses.
Dose-response curve
The dose-effect curve can be obtained from plotting the pharmacological effect intension (E) as y axis versus dosage (D) or concentration (C) of drugs as x axis
Dose & Response in Patients
1. Graded response
In a certain range of doses, the pharmacological response increases with the increasing of doses.
blood pressure, muscle contraction, urinary excretion of sodium
2. Quantal response or all-or-none response
Indicate that a given dose of a drug has or has not evoked a certain effect in the various subjects under investigation.
Expressed with all or none, positive or negative, e.g., death or survival, convulsion or not, paralysis or not
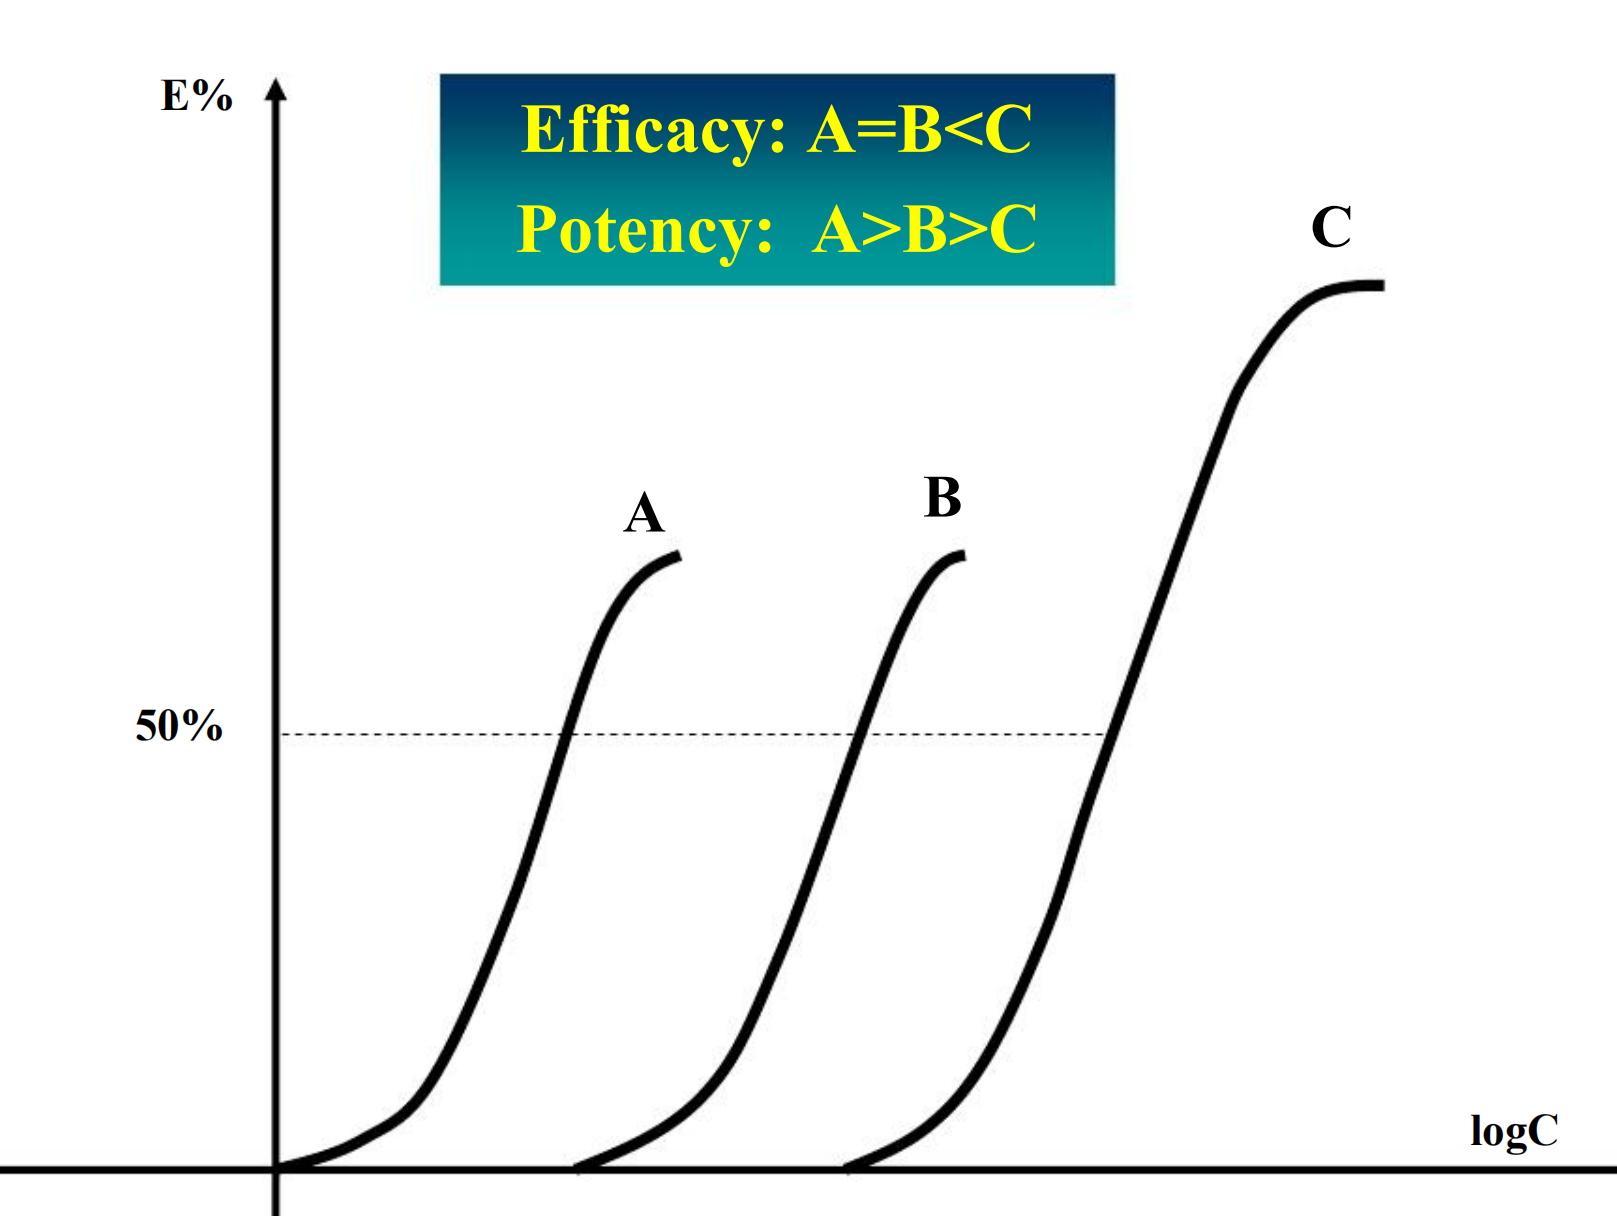
Potency
Refers to the concentration (EC50) or dose (ED50) of a drug required to produce 50% of that drug’s maximal effect.
- What is mean more potent?
- Nitroglycerin is very potent; relatively few molecules need to absorbed to produce the therapeutic effect
- If the drug is to be administered by transdermal absorption, a highly potent drug is required, since the capacity of the skin to absorb drugs is limited
SEMILOG DOSE-RESPONSE CURVE
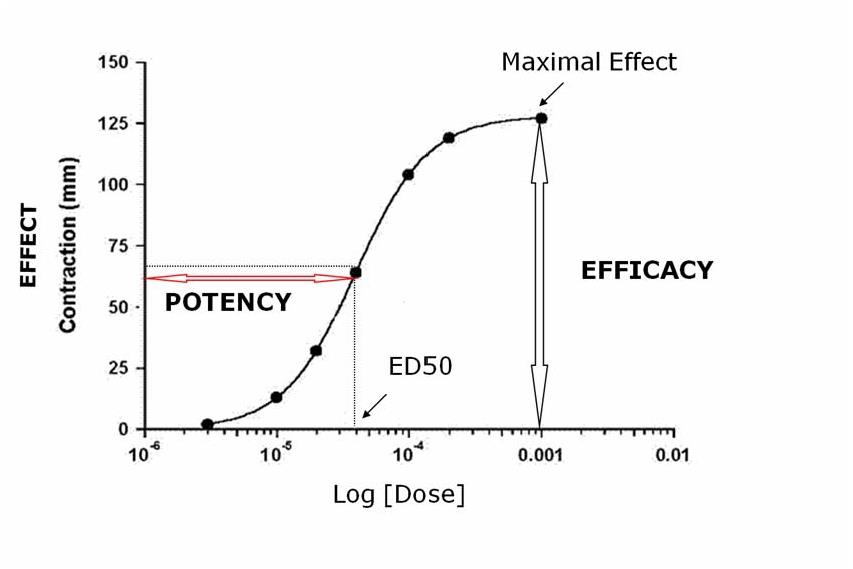
Maximal Efficacy
The maximal effect that can be produced by a drug is its maximal efficacy. It reflects the limit of the dose-response relation on the response axis
The maximal efficacy of a drug for achieving a therapeutic end point may be limited by the drug’s propensity to cause a toxic effect even if the drug could otherwise produce a greater therapeutic effect
Median effect dose (ED50)
For all-or-none responses, the dose of a drug that gives rise to a response in 50% of the subjects is called ED50
It provide a convenient way of comparing the potencies of drugs in experimental and clinical settings
1. Meanings of ED50
If the ED50s of two drugs for producing a specified quantal effect are 5 and 500 mg, respectively, then:
- One can obtain a valuable index of the selectivity of a drug’s action by comparing its ED50s for two different quantal effects in a population
- Eg, cough suppression versus sedation for opioid drugs
Median lethal dose (LD50)
A dose that gives rise to the death of 50% of subjects is called LD50
LD50 is a primary index evaluated the safety of a drug, but it can not reflect the relationship between drug effect and toxic effect.
Therapeutic index (TI)
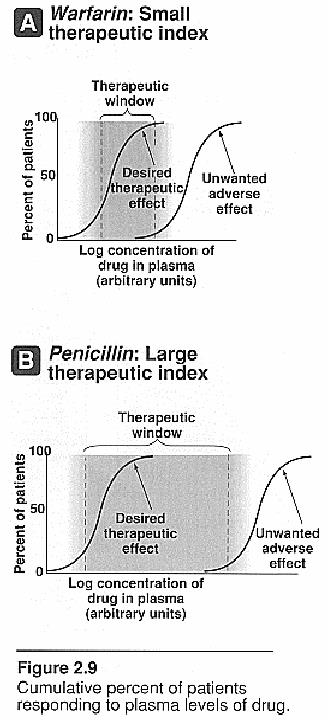
Is a measure which relates the dose of a drug required to produce a desired effect to that which produces an undesired effect -denotes the safety of the drugs
TI=LD50/ED50 (LC50/EC50)
- The larger value of the TI is, the wider margin between effective dose and toxic dose is. For example, the drug of TI=4 is more safe than that of TI=2.