L15 Inheritance of Complex Quantitative Traits
一、Frequency Distributions
Some Definitions
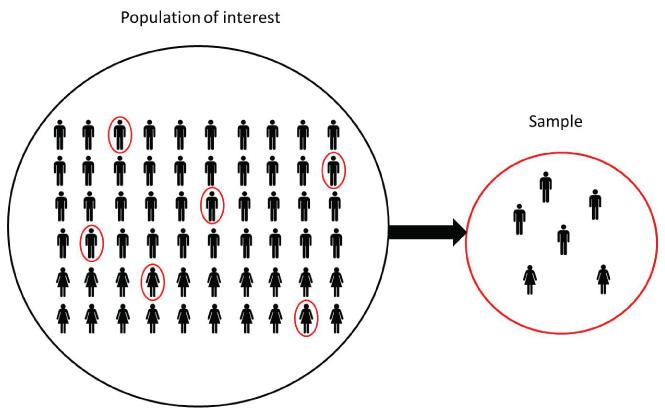
1. Population
Population: Group of individuals interested
2. Sample
Sample: only a small fraction of all the individuals in the population can be measured. We call this group the sample.
3. Frequency Distribution
Frequency distribution: is a list, table or graph that displays the frequency of various outcomes in a sample.
Histogram 柱状图
4. Mean or Average 平均值
1 | |
$$
\overline{x} = \frac{x_1 + x_2 + ··· \ + x_n}{n}
$$
5. Median 中位数
1 | |
6. Mode 众数
1 | |
7. Model Class
The modal class in a sample is the class that contains the most observations.
8. Variance 方差
1 | |
Variance 方差: to measure the spread of data in a frequency distribution
The sample variance, denoted $S^2$ , is calculated from the formula
$$
s^{2} = \frac{\sum (X_{k} - \overline{X})^{2}}{n - 1}
$$
9. standard deviation 标准差
1 | |
$$
s = \sqrt{s^{2}}
$$
二、Quantitative And Qualitative Traits
The Definition
1. Complex / Quantitative Trait 数量性状
A quantitative trait is a measurable phenotype that depends on the cumulative actions of many genes and the environment.
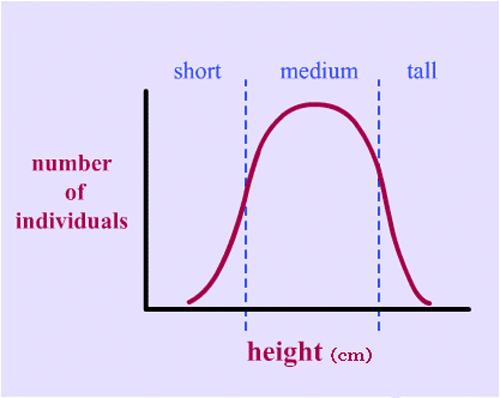
These traits can vary among individuals, over a range, to produce a continuous distribution of phenotypes.
Examples include aspects of morphology (height, weight); physiology (blood pressure); behavior (aggression); as well as molecular phenotypes (gene expression levels, high- and low-density cholesterol levels).
Quantitative traits do not behave according to simple Mendelian inheritance laws.
Individuals cannot be classified by discrete values
Quantitative trait distribution show a continuous range of variation
Complex mode of inheritance
Moderate to great environmental effect
2. Mendelian / Qualitative traits 孟德尔性状/质量性状
Mendelian traits/Qualitative traits
Phenotype with discrete and easy to measure values
Individuals can be correctly classified according to phenotype
Show mendelian inheritance
Little environmental effect
Example of Quantitative Traits
1. Polygenetic in wheat grains color
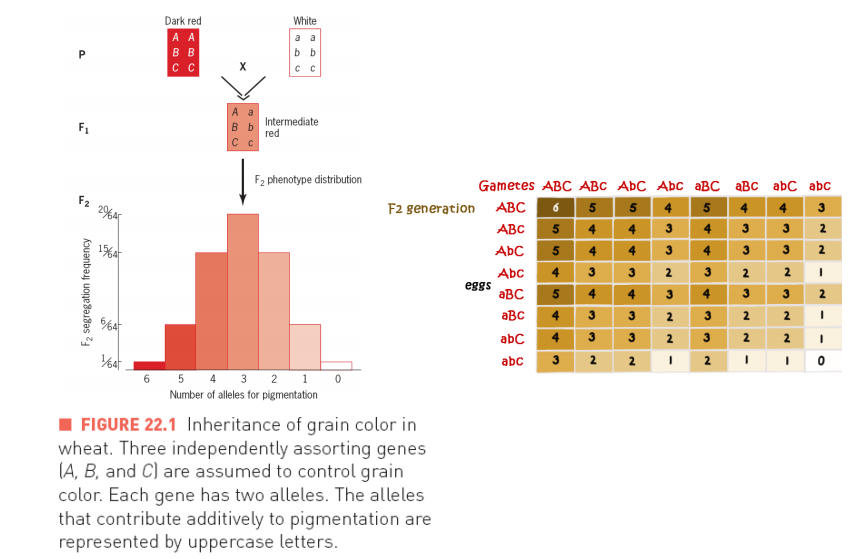
■ FIGURE 22.1 Inheritance of grain color in wheat. Three independently assorting genes [A, B, and C] are assumed to control grain color. Each gene has two alleles. The alleles that contribute additively to pigmentation are represented by uppercase letters.
2. Length of The Corolla In Tobacco Flowers (Studied By Edward M. East)
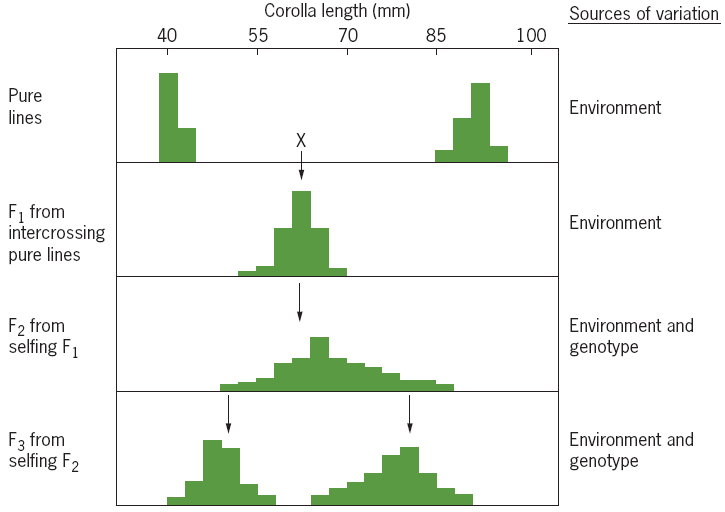
This variability if F2 was due to two sources:
the segregation and independent assortment of different pairs of alleles controlling corolla length, and
environmental factors.
The reduced amount of variation within the F3 lines was presumably due to the segregation of fewer allelic differences.
Edward M. East had studied 444 F2 plants and failed to find even one with either of the parental phenotypes.
This failure would seem to rule out (排除) the hypothesis of four or fewer genes controlling corolla length.
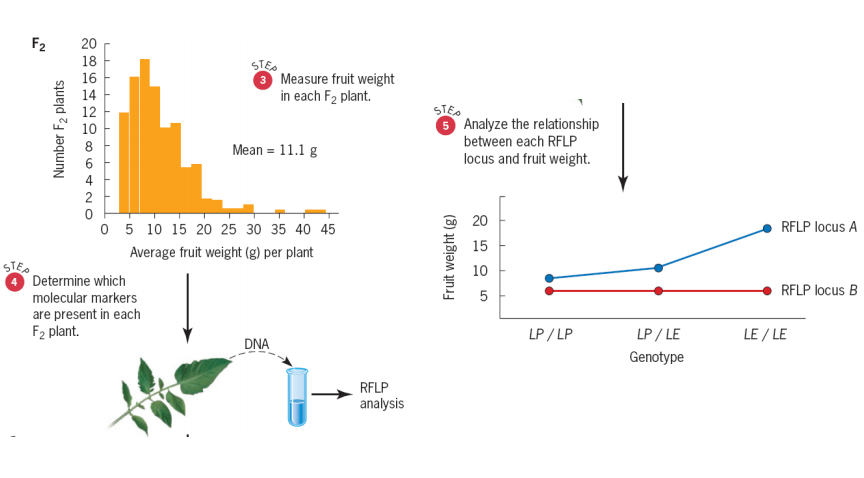
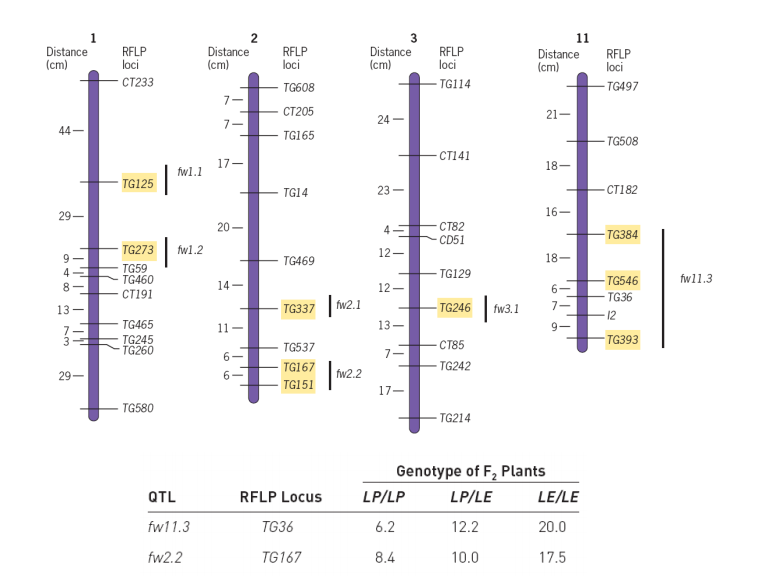
Quantitative Trait Loci
the locus for a gene that influences a quantitative trait is called a quantitative trait locus (QTL).
QT loci have been identified and mapped on specific chromosomes in model laboratory organisms
1. RFLPs
restriction fragment-length polymorphisms, RFLPs (限制性片段长度多态性)
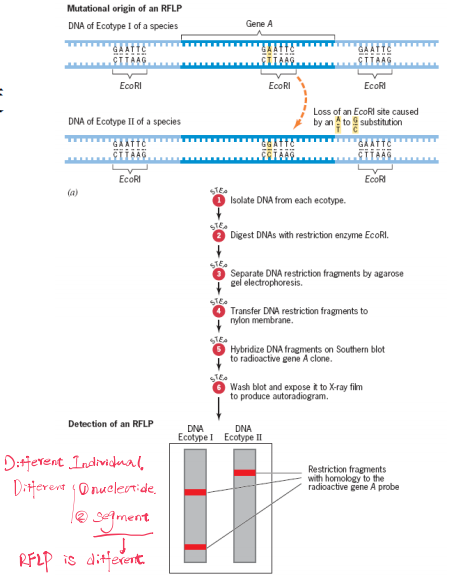
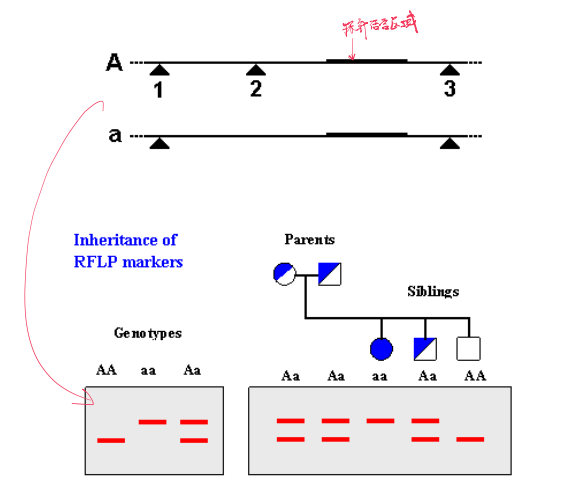
2. RFLP And Quantitative Trait Loci
Steven D. Tanksley exploited the fact that L. pimpinellifoliumand L. esculentum differ in the sites where restriction enzymes cleave genomic DNA. (RFLPs)
三、The Multiple Factor Hypothesis
$\mu$, $g$, $e$ And $T$
The key idea in quantitative genetics is that traits are controlled by many different factors in the environment and in the genotype.
$\mu$ represents the population mean,
g represents the deviation from the mean that is due to genetic factors, and
e represents the deviation from the mean that is due to environmental factors.
$$
T = \mu + g + e
$$
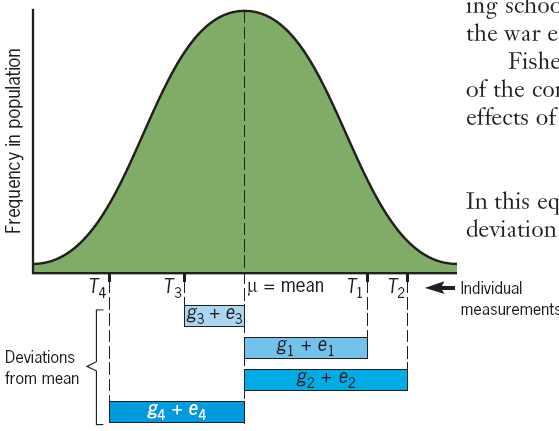
Partitioning the Phenotypic Variance 表型变异的划分
1. Definition
$V_T$ total phenotypic variance
$V_g$ genetic variance
$V_e$ environmental variance
$$
V_{T} = V_{g} + V_{e}
$$
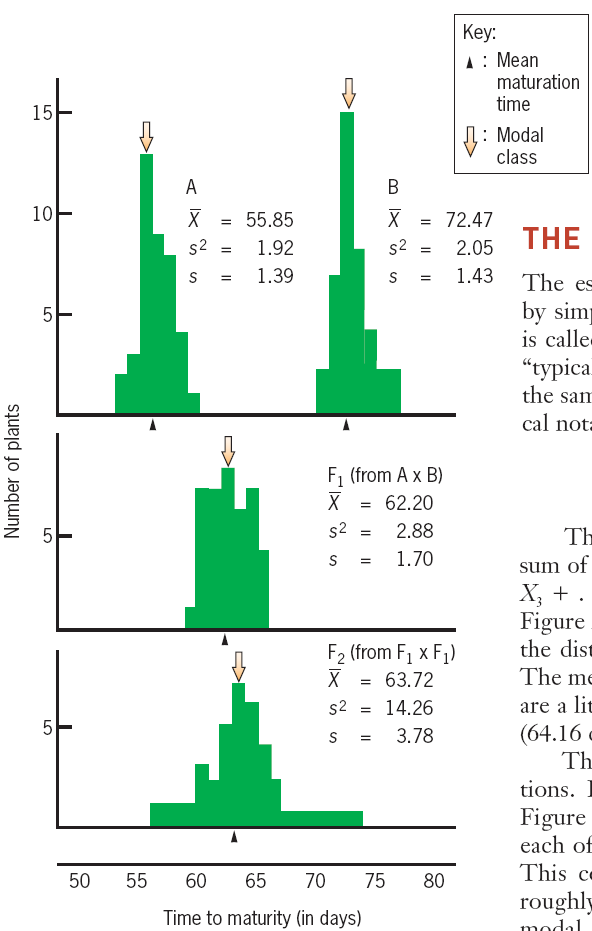
2. Example Calculation
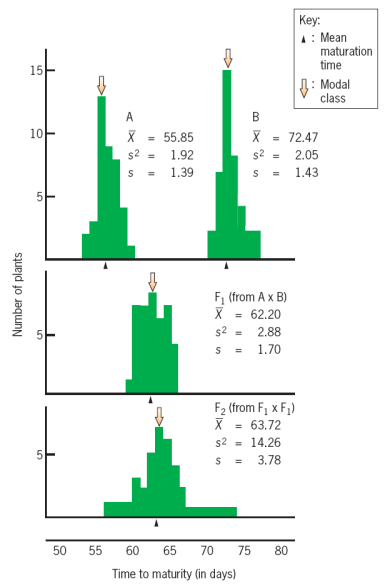
$$
V_{e} = (V_{A} + V_{B} + V_{F1})/3 \ = (1.92\ days^{2} + 2.05\ days^{2} + 2.88 \ days^{2})/3 \ =2.28\ days^{2}
$$
The $V_e$ Average represents the varients of environment
假设F2的生长环境与F1,A,B相同:
$$
\because V_{T} = V_{g} + V_{e} \
\therefore V_{g} = V_{T} - V_{e} \
= 14.26\ days^{2} - 2.28\ days^{2} \
= 11.98\ days^{2}
$$
3. Broad-sense Heritability 广义遗传性
$$
H^{2} = V_{g} / V_{T} \
V_{g} / (V_{g} + V_{e})
$$
For F2 wheat population
$$
V_{T} = V_{g} + V_{e}
$$
$$
14.26\ days^{2} = 11.98\ days^{2} + 2.28\ days^{2}
$$
$$
H^{2} = 11.98/14.26 = 0.84
$$
In this population 84% of the observed variability in wheat maturation time is due to genetic differences among individuals.
$H^{2}$ 代表由gene贡献的“差异”的比例
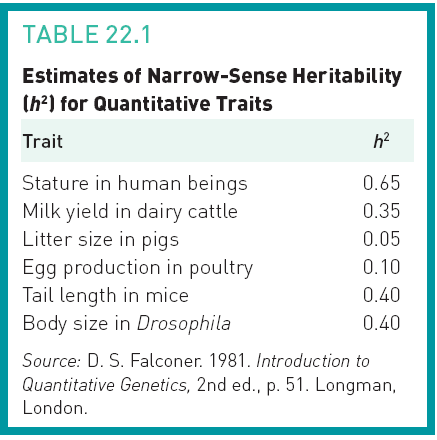
4. Narrow-sense Heritability 狭义遗传性
Genetic variance has three major components: the additive genetic variance (加性遗传方差), dominance variance (显性方差), and epistatic variance (上位方差)
Additive genetic variance involves the inheritance of a particular allele from your parent and this allele’s independent effect on the specific phenotype, which will cause the phenotype deviation from the mean phenotype
Dominance genetic variance refers to the phenotype deviation caused by the interactions between alternative alleles that control one trait at one specific locus.
Epistatic variance involves an interaction between different alleles in different loci
$$
V_{g} = V_{a} + V_{d} + V_{i}
$$
$$
\therefore V_{T} = V_{a} + V_{d} + V_{i} + V_{e}
$$
$$
h^{2} = V_{a} / V_{T}
$$
The closer $h^{2}$ is to one, the greater is our ability to predict an offspring’s phenotype.
Thus, if we knew the parental phenotypes, we would be better able to predict the height of a human’s offspring than the litter size of a pig’s offspring.
五、Predicting Phenotypes
Example Calculation: IQ
the narrow-sense heritability of IQ has been estimated to be about $h^{2}$=0.4 — that is, about 40% of the observed variation in IQ scores is due to the additive effects of alleles.
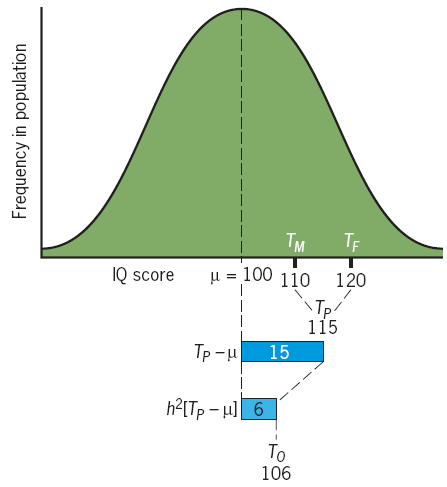 $$
T_{o} = \mu + h^{2}[(T_{M} + T_{F})/2 - \mu]
$$
$T_{o}$ is the mean of the offspring, $\mu$ is the mean of the overall population
$$
T_{o} = \mu + h^{2}[(T_{M} + T_{F})/2 - \mu]
$$
$T_{o}$ is the mean of the offspring, $\mu$ is the mean of the overall population
$T_{s}$ is the mean of the selected parents, and $h^{2}$ is the narrow-sense heritability.
$(T_{M} + T_{F})/2$ is usually called the midparent value (中间价)
$$
\therefore T_{o} = h^{2} [T_{P} - \mu]
$$
$$
\therefore T_{o} = 100 + (0.4)[115 - 100] = 106
$$
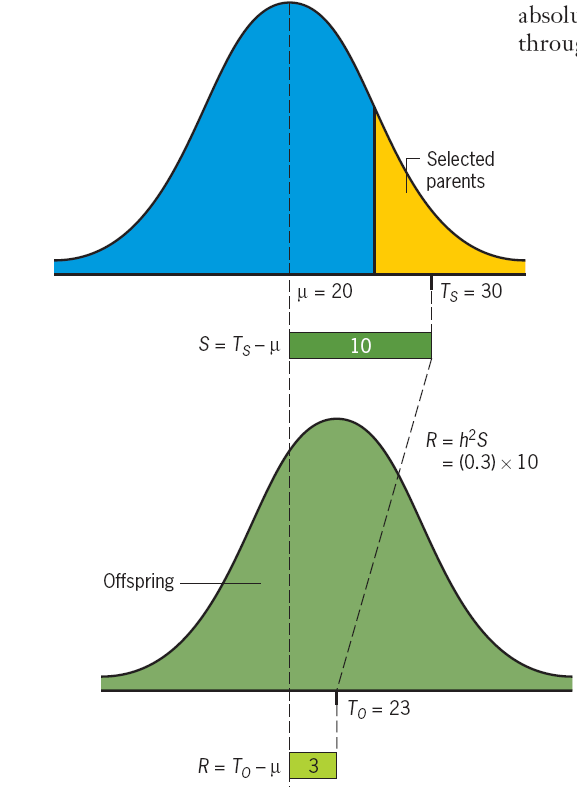
Artificial Selection
$T_{o} = h^{2} [T_{P} - \mu]$ , this equation allows us to predict how the mean of the population will change by selecting the individuals that will be parents. We call this process artificial selection.
$$
[T_{o} - \mu] = h^{2} [T_{s} - \mu]
$$
$$
R = h^{2} S
$$
S: selection differential 选择差异
R: the response to selection
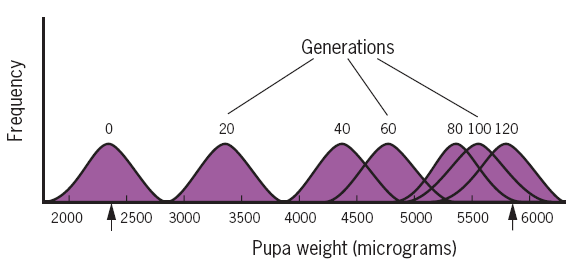
Frequency distributions of pupa weight in Tribolium populations selected for increased size. The shape of the distributions is only approximate. The means at generations 0 and 120 are indicated by arrows.